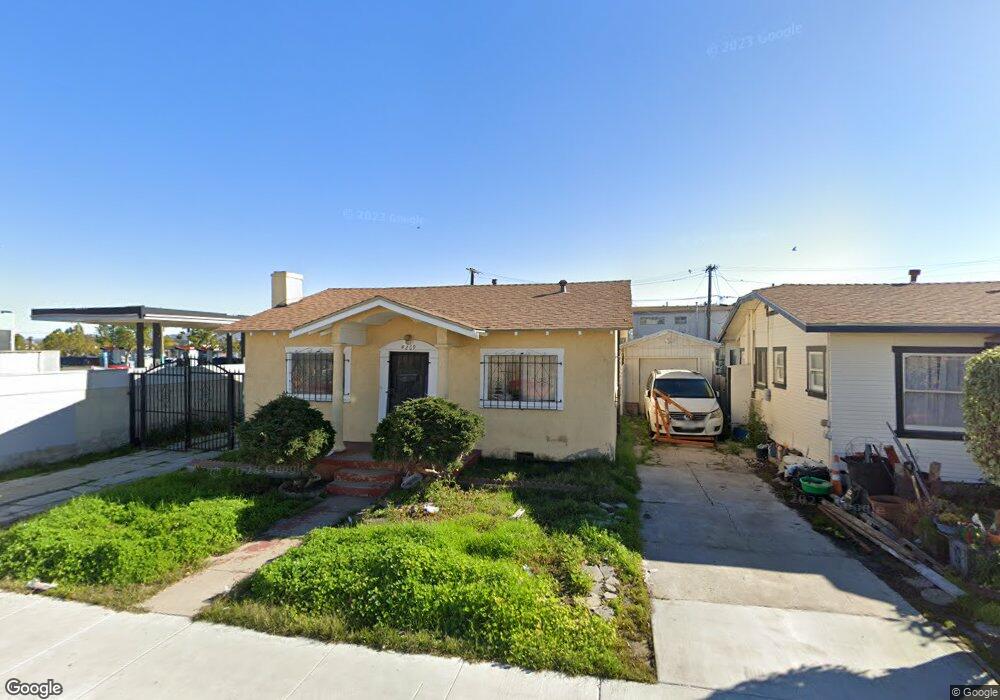
4269 39th St San Diego, CA 92105
Corridor NeighborhoodEstimated Value: $639,000 - $870,000
3
Beds
1
Bath
1,080
Sq Ft
$709/Sq Ft
Est. Value
About This Home
This home is located at 4269 39th St, San Diego, CA 92105 and is currently estimated at $765,890, approximately $709 per square foot. 4269 39th St is a home located in San Diego County with nearby schools including Central Elementary School, Wilson Middle School, and Herbert Hoover High School.
Ownership History
Date
Name
Owned For
Owner Type
Purchase Details
Closed on
Jan 6, 2020
Sold by
Lee Chee Chung and Lee Chee Man
Bought by
Huang Xftkying
Current Estimated Value
Purchase Details
Closed on
Aug 15, 2019
Sold by
Lee Chee Yee
Bought by
Lee Chee Chung
Purchase Details
Closed on
May 13, 2006
Sold by
Lee Mei Ling Wong
Bought by
Lee Chee Yee and Lee Chee Chung
Create a Home Valuation Report for This Property
The Home Valuation Report is an in-depth analysis detailing your home's value as well as a comparison with similar homes in the area
Home Values in the Area
Average Home Value in this Area
Purchase History
| Date | Buyer | Sale Price | Title Company |
|---|---|---|---|
| Huang Xftkying | $350,000 | Lawyers Title Company | |
| Lee Chee Chung | -- | None Available | |
| Lee Chee Yee | -- | None Available |
Source: Public Records
Tax History Compared to Growth
Tax History
| Year | Tax Paid | Tax Assessment Tax Assessment Total Assessment is a certain percentage of the fair market value that is determined by local assessors to be the total taxable value of land and additions on the property. | Land | Improvement |
|---|---|---|---|---|
| 2025 | $4,594 | $382,771 | $264,172 | $118,599 |
| 2024 | $4,594 | $375,267 | $258,993 | $116,274 |
| 2023 | $4,490 | $367,910 | $253,915 | $113,995 |
| 2022 | $4,370 | $360,697 | $248,937 | $111,760 |
| 2021 | $4,339 | $353,625 | $244,056 | $109,569 |
| 2020 | $2,234 | $176,142 | $121,565 | $54,577 |
| 2019 | $542 | $38,467 | $21,925 | $16,542 |
| 2018 | $511 | $37,714 | $21,496 | $16,218 |
| 2017 | $499 | $36,975 | $21,075 | $15,900 |
| 2016 | $490 | $36,251 | $20,662 | $15,589 |
| 2015 | $483 | $35,707 | $20,352 | $15,355 |
| 2014 | $477 | $35,009 | $19,954 | $15,055 |
Source: Public Records
Map
Nearby Homes
- 4233 39th St Unit C
- 4342 39th St
- 4164 38th St
- 4411 Mcclintock St
- 4119 Orange Ave
- 4174 Marlborough Ave Unit 8
- 3909 Monroe Ave Unit 101
- 4041 38th St
- 4164 Cherokee Ave Unit G
- 3848 Monroe Ave
- 4102 Cherokee Ave
- 4358-64 36th St
- 4146-50 Monroe Ave
- 4153 Wilson Ave
- 3890 37th St
- 4344 Van Dyke Ave
- 4332 Wilson Ave
- 3846 38th St Unit 5
- 3846 38th St Unit 3
- 4554 Marlborough Dr Unit 1
- 4263 39th St
- 4259 - 426 39th St
- 4259 39th St Unit 61
- 4255 39th St
- 4251 39th St
- 4270 40th St Unit 74
- 4253 39th St
- 4256 40th St Unit 58
- 4262 40th St Unit 64
- 4252 40th St
- 4243 39th St Unit B
- 4243 39th St Unit A
- 4246 40th St
- 4241 39th St Unit 4241
- 4233 39th St Unit D
- 4233 39th St Unit B
- 4233 39th St Unit A
- 4242-4252 St
- 4242 40th St
- 4230 40th St Unit 32