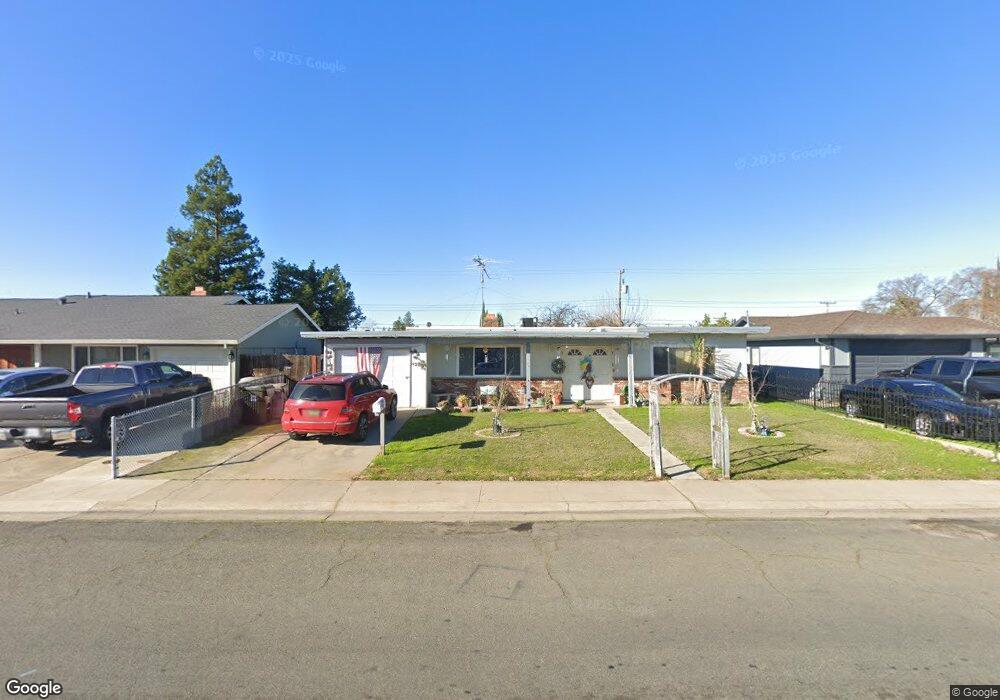
4269 Austin St Sacramento, CA 95838
Glenwood Meadows NeighborhoodEstimated Value: $201,000 - $406,000
2
Beds
2
Baths
1,320
Sq Ft
$258/Sq Ft
Est. Value
About This Home
This home is located at 4269 Austin St, Sacramento, CA 95838 and is currently estimated at $341,007, approximately $258 per square foot. 4269 Austin St is a home located in Sacramento County with nearby schools including Glenwood Elementary School, Rio Linda Preparatory Academy, and Norwood Junior High School.
Ownership History
Date
Name
Owned For
Owner Type
Purchase Details
Closed on
Jan 19, 2012
Sold by
Song Sheng Jun
Bought by
Fu Yang Investment Llc
Current Estimated Value
Purchase Details
Closed on
Aug 17, 2011
Sold by
Owb Reo Llc
Bought by
Song Sheng Jun
Purchase Details
Closed on
Apr 5, 2011
Sold by
Mejia Ena C and Mortgage Electronic Registrati
Bought by
Owb Reo Llc
Purchase Details
Closed on
Apr 19, 2004
Sold by
Burman Steven Douglas
Bought by
Mejia Ena C
Home Financials for this Owner
Home Financials are based on the most recent Mortgage that was taken out on this home.
Original Mortgage
$168,000
Interest Rate
5.75%
Mortgage Type
Purchase Money Mortgage
Purchase Details
Closed on
Sep 16, 1997
Sold by
Burman Kathy Ann
Bought by
Burman Steven Douglas
Create a Home Valuation Report for This Property
The Home Valuation Report is an in-depth analysis detailing your home's value as well as a comparison with similar homes in the area
Home Values in the Area
Average Home Value in this Area
Purchase History
| Date | Buyer | Sale Price | Title Company |
|---|---|---|---|
| Fu Yang Investment Llc | -- | None Available | |
| Song Sheng Jun | $53,500 | Lsi Title Company Ca | |
| Owb Reo Llc | $90,000 | Accommodation | |
| Mejia Ena C | $210,000 | Financial Title Company | |
| Burman Steven Douglas | -- | First American Title Ins Co |
Source: Public Records
Mortgage History
| Date | Status | Borrower | Loan Amount |
|---|---|---|---|
| Previous Owner | Mejia Ena C | $168,000 | |
| Closed | Mejia Ena C | $42,000 |
Source: Public Records
Tax History Compared to Growth
Tax History
| Year | Tax Paid | Tax Assessment Tax Assessment Total Assessment is a certain percentage of the fair market value that is determined by local assessors to be the total taxable value of land and additions on the property. | Land | Improvement |
|---|---|---|---|---|
| 2025 | $1,091 | $66,807 | $25,114 | $41,693 |
| 2024 | $1,091 | $65,498 | $24,622 | $40,876 |
| 2023 | $1,116 | $64,215 | $24,140 | $40,075 |
| 2022 | $1,062 | $62,957 | $23,667 | $39,290 |
| 2021 | $1,057 | $61,723 | $23,203 | $38,520 |
| 2020 | $1,037 | $61,092 | $22,966 | $38,126 |
| 2019 | $1,032 | $59,895 | $22,516 | $37,379 |
| 2018 | $967 | $58,722 | $22,075 | $36,647 |
| 2017 | $1,113 | $57,572 | $21,643 | $35,929 |
| 2016 | $936 | $56,444 | $21,219 | $35,225 |
| 2015 | $875 | $55,597 | $20,901 | $34,696 |
| 2014 | $885 | $54,509 | $20,492 | $34,017 |
Source: Public Records
Map
Nearby Homes
- 335 Jessie Ave
- 328 Las Animas Cir
- 230 Du Bois Ave
- 173 Bell Ave
- 4323 Oconner Way
- 2 Keely Ct
- 400 Berthoud St
- 541 Samuel Way
- 568 Samuel Way
- 1 Butterwick Ct
- 4550 Norwood Ave
- 3940 Norwood Ave
- 131 Mcdaniel Cir
- 204 Arbor Crest Way
- 4561 Tidewind Dr
- 3815 Lee Brook Way
- Plan 7 at Valley Vista
- Plan 3 at Valley Vista
- Plan 7 at Valley Vista
- Plan 8 at Valley Vista