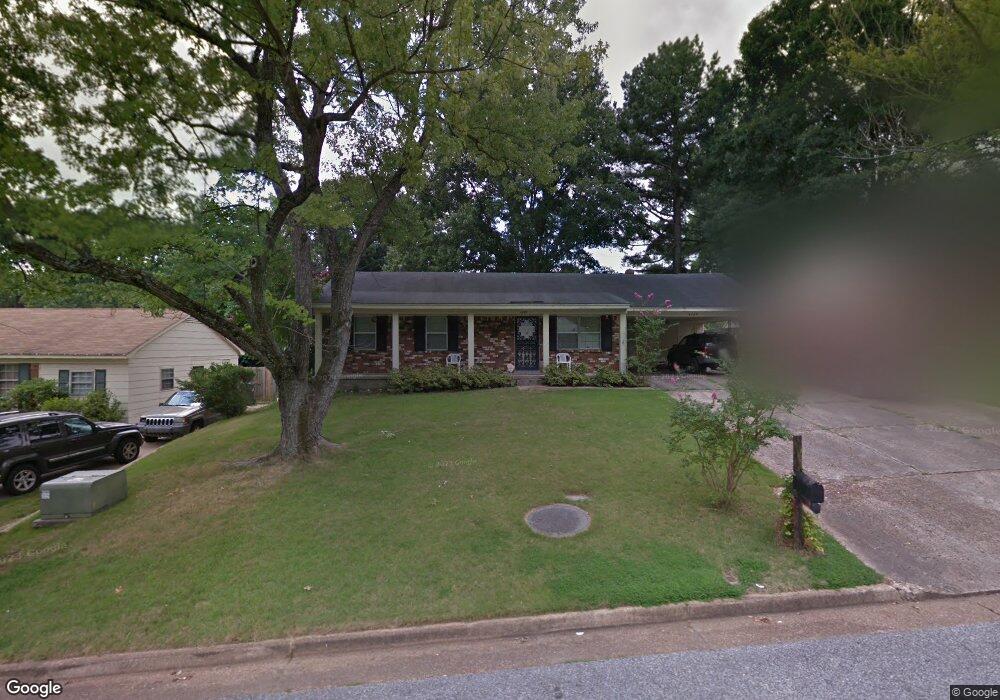
4269 Genyth Ave Memphis, TN 38128
Raleigh NeighborhoodEstimated Value: $155,000 - $194,000
3
Beds
2
Baths
1,855
Sq Ft
$93/Sq Ft
Est. Value
About This Home
This home is located at 4269 Genyth Ave, Memphis, TN 38128 and is currently estimated at $173,166, approximately $93 per square foot. 4269 Genyth Ave is a home located in Shelby County with nearby schools including Scenic Hills Elementary School, Raleigh Egypt High School, and Coleman School.
Ownership History
Date
Name
Owned For
Owner Type
Purchase Details
Closed on
May 31, 2007
Sold by
Baker Freddie Lee and Baker Theresa J
Bought by
Calhoun Ray A
Current Estimated Value
Home Financials for this Owner
Home Financials are based on the most recent Mortgage that was taken out on this home.
Original Mortgage
$100,000
Outstanding Balance
$60,496
Interest Rate
6.16%
Mortgage Type
Purchase Money Mortgage
Estimated Equity
$112,670
Purchase Details
Closed on
Nov 9, 1998
Sold by
Baker Freddie L
Bought by
Baker Freddie Lee and Baker Theresa J
Home Financials for this Owner
Home Financials are based on the most recent Mortgage that was taken out on this home.
Original Mortgage
$76,917
Interest Rate
6.47%
Mortgage Type
FHA
Purchase Details
Closed on
Jul 9, 1997
Sold by
Beard Donald R and Beard Joy
Bought by
Baker Freddie L
Home Financials for this Owner
Home Financials are based on the most recent Mortgage that was taken out on this home.
Original Mortgage
$75,307
Interest Rate
7.7%
Mortgage Type
FHA
Create a Home Valuation Report for This Property
The Home Valuation Report is an in-depth analysis detailing your home's value as well as a comparison with similar homes in the area
Home Values in the Area
Average Home Value in this Area
Purchase History
| Date | Buyer | Sale Price | Title Company |
|---|---|---|---|
| Calhoun Ray A | $100,000 | None Available | |
| Baker Freddie Lee | -- | Stewart Title Company | |
| Baker Freddie Lee | -- | Stewart Title Company | |
| Baker Freddie L | $75,000 | -- | |
| Baker Freddie L | $75,000 | -- |
Source: Public Records
Mortgage History
| Date | Status | Borrower | Loan Amount |
|---|---|---|---|
| Open | Calhoun Ray A | $100,000 | |
| Previous Owner | Baker Freddie Lee | $76,917 | |
| Previous Owner | Baker Freddie L | $75,307 |
Source: Public Records
Tax History
| Year | Tax Paid | Tax Assessment Tax Assessment Total Assessment is a certain percentage of the fair market value that is determined by local assessors to be the total taxable value of land and additions on the property. | Land | Improvement |
|---|---|---|---|---|
| 2025 | $1,074 | $43,675 | $3,750 | $39,925 |
| 2024 | $1,074 | $31,675 | $2,900 | $28,775 |
| 2023 | $1,930 | $31,675 | $2,900 | $28,775 |
| 2022 | $1,930 | $31,675 | $2,900 | $28,775 |
| 2021 | $1,952 | $31,675 | $2,900 | $28,775 |
| 2020 | $1,458 | $20,125 | $2,900 | $17,225 |
| 2019 | $1,458 | $20,125 | $2,900 | $17,225 |
| 2018 | $1,458 | $20,125 | $2,900 | $17,225 |
| 2017 | $827 | $20,125 | $2,900 | $17,225 |
| 2016 | $830 | $19,000 | $0 | $0 |
| 2014 | $830 | $19,000 | $0 | $0 |
Source: Public Records
Map
Nearby Homes
- 3788 Raleigh Millington Rd
- 4326 Ann Arbor Ln
- 4093 Twilight Ave
- 4348 Manor Haven Dr
- 4395 Ann Arbor Ln
- 4053 Lehi Dr
- 4057 Timberwood Dr
- 3614 Raleigh Millington Rd
- 3823 Barberry St
- 4376 Coleman Rd
- 3566 Monessen Dr
- 3941 Stillwood Dr
- 3953 Otter Dr
- 3926 Kerwin Dr
- 4626 St Elmo Ave
- 3569 Powers Rd
- 3981 Glendale Dr
- 4014 Kerwin Dr
- 3461 Glenshaw Dr
- 3909 Dante Ave
- 4277 Genyth Ave
- 4263 Genyth Ave
- 4268 Hallview Dr
- 3835 Hanna Dr
- 4255 Genyth Ave
- 4262 Hallview Dr
- 4276 Hallview Dr
- 4270 Genyth Ave
- 4276 Genyth Ave
- 4284 Hallview Dr
- 4264 Genyth Ave
- 4247 Genyth Ave
- 4286 Genyth Ave
- 4256 Genyth Ave
- 4246 Hallview Dr
- 4024 Naylor Dr
- 4248 Genyth Ave
- 4239 Genyth Ave
- 4267 Hallview Dr
- 3834 Hanna Dr
Your Personal Tour Guide
Ask me questions while you tour the home.