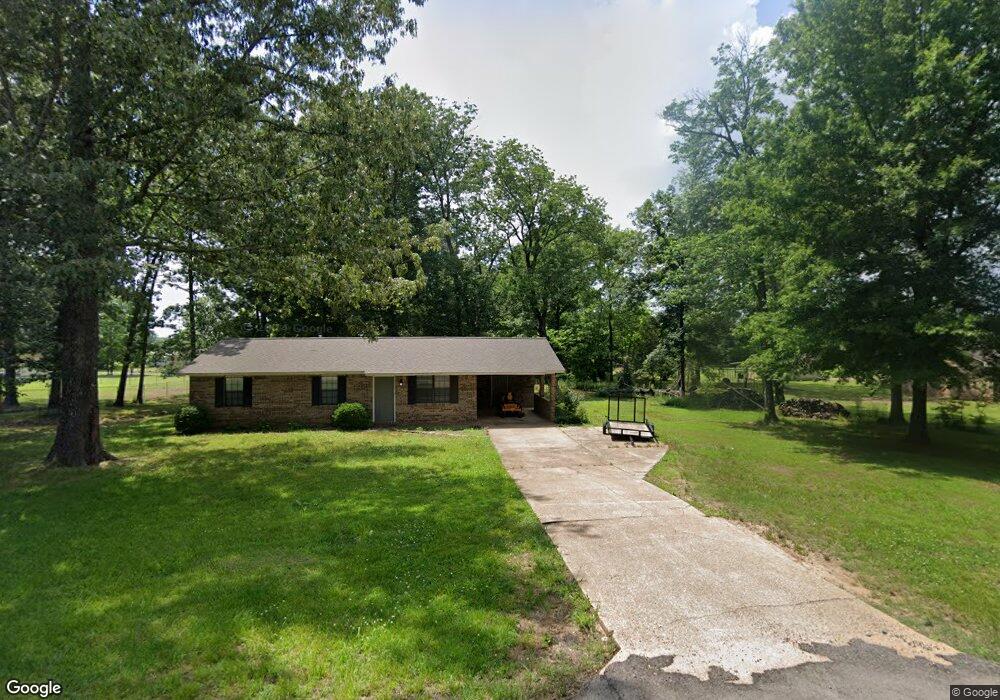
4269 N Tva Rd West Point, MS 39773
Estimated Value: $143,225 - $171,000
3
Beds
--
Bath
1,229
Sq Ft
$126/Sq Ft
Est. Value
About This Home
This home is located at 4269 N Tva Rd, West Point, MS 39773 and is currently estimated at $154,556, approximately $125 per square foot. 4269 N Tva Rd is a home located in Clay County with nearby schools including East Side Elementary School, West Clay Elementary School, and Church Hill Elementary School.
Ownership History
Date
Name
Owned For
Owner Type
Purchase Details
Closed on
May 10, 2024
Sold by
Patrick Samuel Eli
Bought by
Thompson Olivia Evette
Current Estimated Value
Home Financials for this Owner
Home Financials are based on the most recent Mortgage that was taken out on this home.
Original Mortgage
$146,526
Outstanding Balance
$144,161
Interest Rate
6.79%
Mortgage Type
FHA
Estimated Equity
$10,395
Purchase Details
Closed on
Mar 23, 2020
Sold by
Fannie Mae
Bought by
Field Walter Williams
Create a Home Valuation Report for This Property
The Home Valuation Report is an in-depth analysis detailing your home's value as well as a comparison with similar homes in the area
Home Values in the Area
Average Home Value in this Area
Purchase History
| Date | Buyer | Sale Price | Title Company |
|---|---|---|---|
| Thompson Olivia Evette | -- | None Listed On Document | |
| Field Walter Williams | -- | -- |
Source: Public Records
Mortgage History
| Date | Status | Borrower | Loan Amount |
|---|---|---|---|
| Open | Thompson Olivia Evette | $146,526 |
Source: Public Records
Tax History Compared to Growth
Tax History
| Year | Tax Paid | Tax Assessment Tax Assessment Total Assessment is a certain percentage of the fair market value that is determined by local assessors to be the total taxable value of land and additions on the property. | Land | Improvement |
|---|---|---|---|---|
| 2024 | $619 | $11,013 | $1,575 | $9,438 |
| 2023 | $1,050 | $9,251 | $1,575 | $7,676 |
| 2022 | $517 | $9,251 | $1,575 | $7,676 |
| 2021 | $509 | $9,186 | $1,575 | $7,611 |
| 2020 | $515 | $9,186 | $1,575 | $7,611 |
| 2019 | $482 | $9,115 | $1,575 | $7,540 |
| 2018 | $185 | $6,077 | $1,050 | $5,027 |
| 2017 | $185 | $6,077 | $1,050 | $5,027 |
| 2016 | $174 | $6,077 | $1,050 | $5,027 |
| 2015 | $168 | $5,612 | $1,050 | $4,562 |
| 2014 | $144 | $5,612 | $1,050 | $4,562 |
| 2013 | $144 | $5,612 | $1,050 | $4,562 |
Source: Public Records
Map
Nearby Homes
- 0 Us-45 Alt N Lot 14
- 446 Tva Rd
- 201 Quail Ridge Rd
- 10005 Highway 45 Alternate N
- 0 Us Hwy 45a Unit 4033641
- 0 Us Hwy 45a Unit 22-3720
- 399 Lone Oak Dr
- 165 William Huffman Rd
- 593 Lone Oak Dr
- 218 Lewellen St
- 318 Progress St
- 63 Clay St
- 530 E Morrow St
- 564 E Morrow St
- 0 Mississippi 50
- 26788 E Main St
- 26852 E Main St
- 27045 E Main St
- 26596 E Main St
- 1124 N Eshman Ave
- 4013 N Tva Rd
- 4239 N Tva Rd
- 4049 N Tva Rd
- 4074 N Tva Rd
- 4114 N Tva Rd
- 4132 N Tva Rd
- 4174 N Tva Rd
- 4316 N Tva Rd
- 2753 N Tva Rd
- 3126 N Tva Rd
- 3167 N Tva Rd
- 1570 E Tva Rd
- 2380 Meadowview Cove
- 2403 Meadowview Cove
- 2400 Meadowview Cove
- 2410 Meadowview Cove
- 3244 N Tva Rd
- 3598 N Tva Rd
- 3308 N Tva Rd
- 3364 N Tva Rd