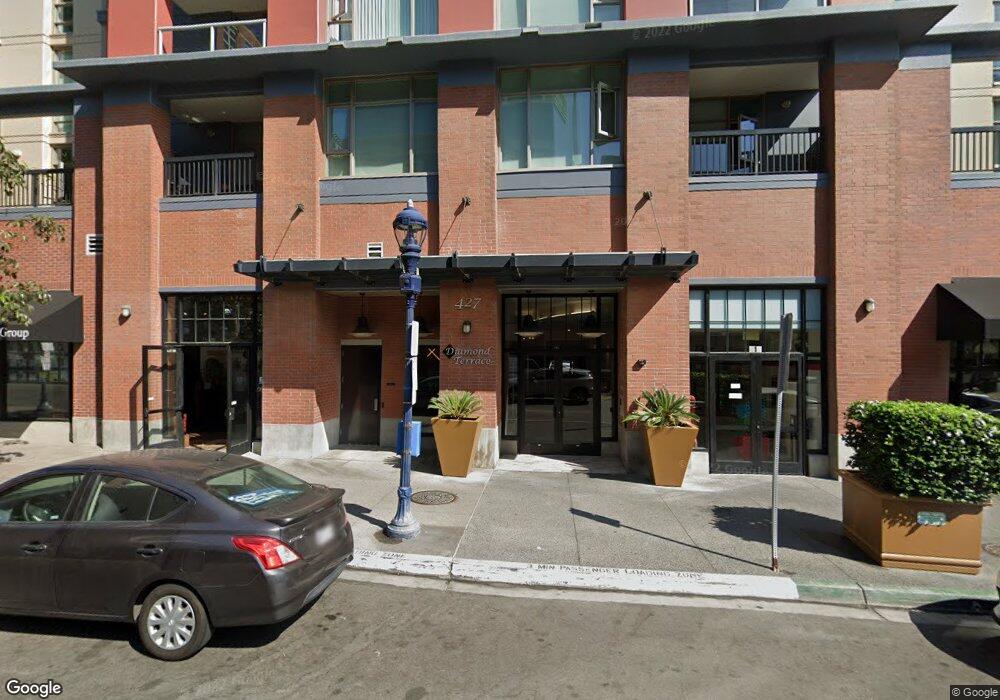
Diamond Terrace 427 9th Ave Unit 706 San Diego, CA 92101
East Village NeighborhoodEstimated Value: $709,000 - $925,000
2
Beds
2
Baths
963
Sq Ft
$818/Sq Ft
Est. Value
About This Home
This home is located at 427 9th Ave Unit 706, San Diego, CA 92101 and is currently estimated at $787,894, approximately $818 per square foot. 427 9th Ave Unit 706 is a home located in San Diego County with nearby schools including Sherman Elementary School, Logan Memorial Educational Campus, and Urban Discovery Academy Charter.
Ownership History
Date
Name
Owned For
Owner Type
Purchase Details
Closed on
Apr 27, 2018
Sold by
Pala Serhat and Llgaz Zeynep
Bought by
Pala Llc
Current Estimated Value
Purchase Details
Closed on
Oct 18, 2017
Sold by
Paul Deborah M
Bought by
Pala Serhat and Ligaz Zeynep
Home Financials for this Owner
Home Financials are based on the most recent Mortgage that was taken out on this home.
Original Mortgage
$385,000
Outstanding Balance
$321,238
Interest Rate
3.78%
Mortgage Type
New Conventional
Estimated Equity
$466,656
Purchase Details
Closed on
Mar 29, 2016
Sold by
Paul Steven D
Bought by
Paul Deborah M
Purchase Details
Closed on
Aug 2, 2007
Sold by
Paul Deborah M
Bought by
Paul Steven D
Purchase Details
Closed on
Aug 15, 2005
Sold by
Paul Deborah M
Bought by
Paul Steven D
Create a Home Valuation Report for This Property
The Home Valuation Report is an in-depth analysis detailing your home's value as well as a comparison with similar homes in the area
Home Values in the Area
Average Home Value in this Area
Purchase History
| Date | Buyer | Sale Price | Title Company |
|---|---|---|---|
| Pala Llc | -- | None Available | |
| Pala Serhat | $607,500 | Fidelity National Title | |
| Paul Deborah M | -- | None Available | |
| Paul Steven D | -- | Fidelity National Title | |
| Paul Steven D | -- | Fidelity National Title | |
| Paul Steven D | -- | Fidelity National Title Co |
Source: Public Records
Mortgage History
| Date | Status | Borrower | Loan Amount |
|---|---|---|---|
| Open | Pala Serhat | $385,000 |
Source: Public Records
Tax History Compared to Growth
Tax History
| Year | Tax Paid | Tax Assessment Tax Assessment Total Assessment is a certain percentage of the fair market value that is determined by local assessors to be the total taxable value of land and additions on the property. | Land | Improvement |
|---|---|---|---|---|
| 2025 | $8,518 | $691,227 | $455,130 | $236,097 |
| 2024 | $8,518 | $677,674 | $446,206 | $231,468 |
| 2023 | $8,326 | $664,387 | $437,457 | $226,930 |
| 2022 | $8,102 | $651,361 | $428,880 | $222,481 |
| 2021 | $8,040 | $638,590 | $420,471 | $218,119 |
| 2020 | $7,940 | $632,043 | $416,160 | $215,883 |
| 2019 | $7,794 | $619,650 | $408,000 | $211,650 |
| 2018 | $7,290 | $607,500 | $400,000 | $207,500 |
| 2017 | $82 | $584,598 | $147,180 | $437,418 |
| 2016 | $6,482 | $540,000 | $134,000 | $406,000 |
| 2015 | $6,125 | $510,000 | $127,000 | $383,000 |
| 2014 | $6,132 | $510,000 | $127,000 | $383,000 |
Source: Public Records
About Diamond Terrace
Map
Nearby Homes
- 427 9th Ave Unit 601
- 427 9th Ave Unit 406
- 427 9th Ave Unit 704
- 427 9th Ave Unit 1308
- 427 9th Ave Unit 1305
- 427 9th Ave Unit 707
- 427 9th Ave Unit 405
- 427 9th Ave Unit 501
- 877 Island Ave Unit 808
- 877 Island Ave Unit 407
- 877 Island Ave Unit 402
- 877 Island Ave Unit 1006
- 1025 Island Ave Unit 402
- 1025 Island Ave Unit 407
- 1025 Island Ave Unit 313
- 321 10th Ave Unit 509
- 321 10th Ave Unit 1706
- 321 10th Ave Unit 903
- 350 11th Ave Unit 319
- 350 11th Ave Unit 922
- 427 UNIT 7 9 Th Ave
- 427 9th Ave
- 427 9th Ave Unit Diamond Terrace Unit
- 427 9th Ave Unit 130
- 427 9th Ave
- 427 9th Ave Unit A
- 427 9th Ave Unit 407
- 427 9th Ave Unit 903
- 427 9th Ave Unit 902
- 427 9th Ave Unit 901
- 427 9th Ave Unit 809
- 427 9th Ave Unit 808
- 427 9th Ave Unit 807
- 427 9th Ave Unit 806
- 427 9th Ave Unit 805
- 427 9th Ave Unit 804
- 427 9th Ave Unit 802
- 427 9th Ave Unit 801
- 427 9th Ave Unit 709
- 427 9th Ave Unit 708