427 Clark St Bridgeport, CT 06606
North End NeighborhoodEstimated Value: $336,000 - $385,320
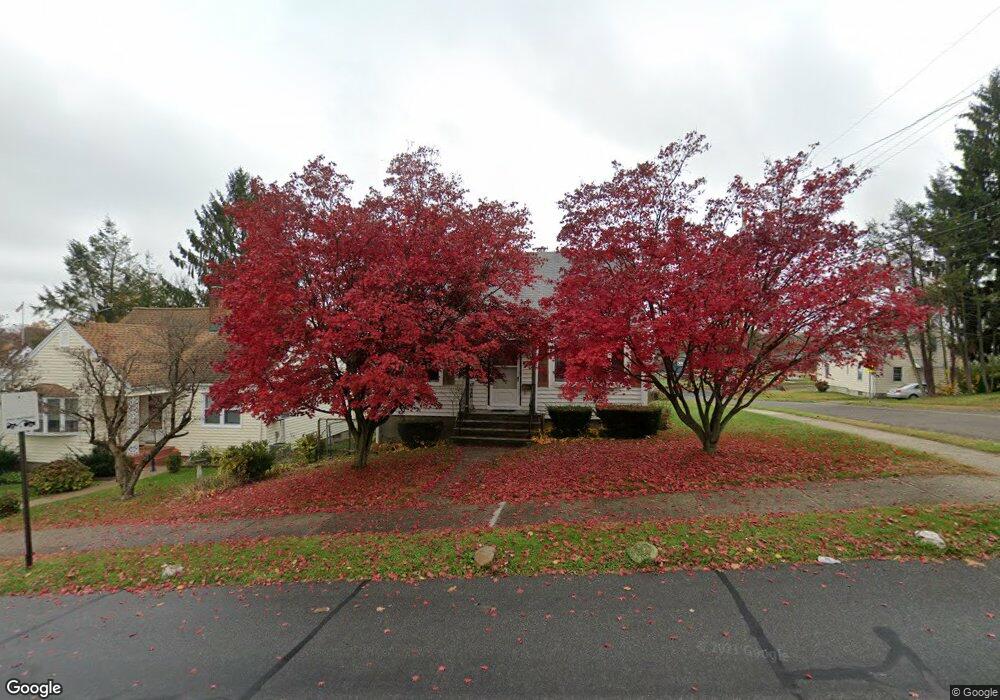
About This Home
This home is located at 427 Clark St, Bridgeport, CT 06606 and is currently estimated at $360,330, approximately $306 per square foot. 427 Clark St is a home located in Fairfield County with nearby schools including Blackham School, Central High School, and Assumption Catholic School.
Ownership History
We collect this data history from publicly available records. To have your information removed, we recommend requesting removal directly through your county’s website.
Purchase Details
Home Financials for this Owner
Home Financials are based on the most recent Mortgage that was taken out on this home.Home Values in the Area
Average Home Value in this Area
Purchase History
We collect this data history from publicly available records. To have your information removed, we recommend requesting removal directly through your county’s website.
| Date | Buyer | Sale Price | Title Company |
|---|---|---|---|
| $78,000 | -- | ||
| $78,000 | -- |
Mortgage History
We collect this data history from publicly available records. To have your information removed, we recommend requesting removal directly through your county’s website.
| Date | Status | Borrower | Loan Amount |
|---|---|---|---|
| Closed | $68,000 |
Tax History
We collect this data history from publicly available records. To have your information removed, we recommend requesting removal directly through your county’s website.
| Year | Tax Paid | Tax Assessment Tax Assessment Total Assessment is a certain percentage of the fair market value that is determined by local assessors to be the total taxable value of land and additions on the property. | Land | Improvement |
|---|---|---|---|---|
| 2025 | $6,182 | $142,280 | $74,300 | $67,980 |
| 2024 | $6,182 | $142,280 | $74,300 | $67,980 |
| 2023 | $6,182 | $142,280 | $74,300 | $67,980 |
| 2022 | $6,182 | $142,280 | $74,300 | $67,980 |
| 2021 | $6,182 | $142,280 | $74,300 | $67,980 |
| 2020 | $5,374 | $99,540 | $42,690 | $56,850 |
| 2019 | $5,374 | $99,540 | $42,690 | $56,850 |
| 2018 | $5,412 | $99,540 | $42,690 | $56,850 |
| 2017 | $5,412 | $99,540 | $42,690 | $56,850 |
| 2016 | $5,412 | $99,540 | $42,690 | $56,850 |
| 2015 | $5,282 | $125,160 | $49,310 | $75,850 |
| 2014 | $5,282 | $125,160 | $49,310 | $75,850 |
Map
- 56 Peet St
- 300 Birmingham St
- 68 Cornell St
- 286 Ruth St
- 26 Marsdale Ave
- 646 Merritt St
- 669 Queen St
- 593 Wayne St
- 113 Clark St
- 316 Goldenrod Ave
- 520 Goldenrod Ave
- 533 Wayne St
- 948 Wayne St
- 337 Jewett Ave
- 415 Jewett Ave
- 405 Westfield Ave
- 210 Stratfield Place
- 315-317 Alexander Ave
- 150 Stratfield Place
- 1095 Wayne St
Ask me questions while you tour the home.