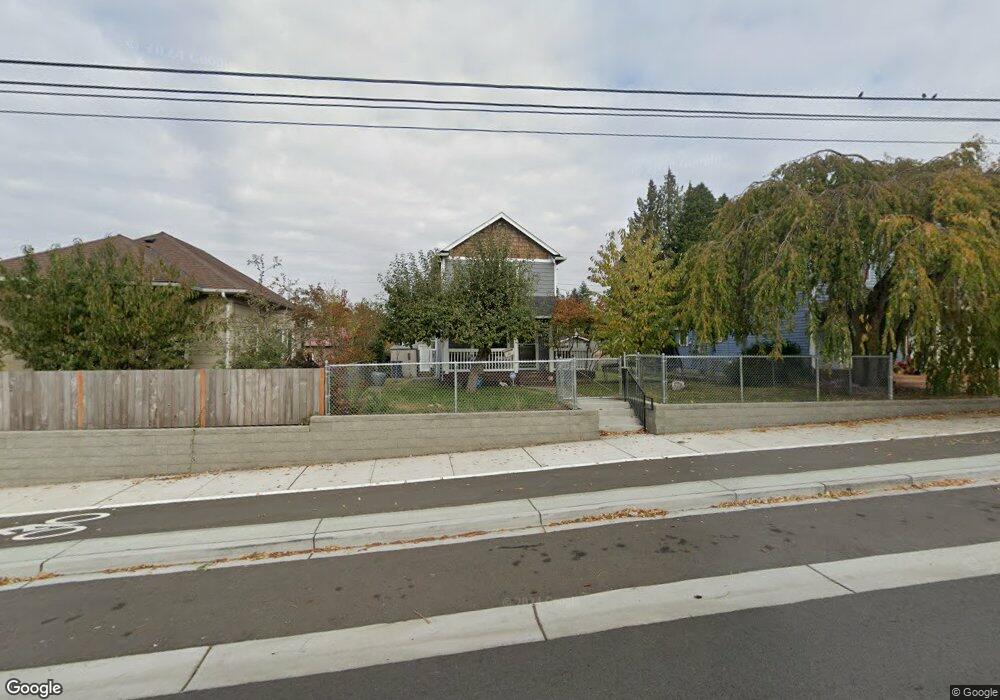
427 E 64th St Tacoma, WA 98404
Eastside NeighborhoodEstimated Value: $472,000 - $491,000
3
Beds
3
Baths
1,472
Sq Ft
$326/Sq Ft
Est. Value
About This Home
This home is located at 427 E 64th St, Tacoma, WA 98404 and is currently estimated at $480,558, approximately $326 per square foot. 427 E 64th St is a home located in Pierce County with nearby schools including Oakland High School, Hunt Middle School, and Mount Tahoma High School.
Ownership History
Date
Name
Owned For
Owner Type
Purchase Details
Closed on
Nov 24, 2003
Sold by
Carriage House Development Inc
Bought by
Solomon Carol
Current Estimated Value
Home Financials for this Owner
Home Financials are based on the most recent Mortgage that was taken out on this home.
Original Mortgage
$142,661
Outstanding Balance
$66,138
Interest Rate
6%
Mortgage Type
FHA
Estimated Equity
$414,420
Purchase Details
Closed on
Aug 1, 2003
Sold by
Estate Of Ethel L Potter
Bought by
Carriage House Development Inc
Home Financials for this Owner
Home Financials are based on the most recent Mortgage that was taken out on this home.
Original Mortgage
$110,400
Interest Rate
5.29%
Mortgage Type
Purchase Money Mortgage
Purchase Details
Closed on
Feb 26, 2003
Sold by
Emerson Ralph W
Bought by
Potter Melvin L and Potter Ethel L
Create a Home Valuation Report for This Property
The Home Valuation Report is an in-depth analysis detailing your home's value as well as a comparison with similar homes in the area
Home Values in the Area
Average Home Value in this Area
Purchase History
| Date | Buyer | Sale Price | Title Company |
|---|---|---|---|
| Solomon Carol | $144,900 | Fat | |
| Carriage House Development Inc | $30,000 | Fat | |
| Potter Melvin L | -- | -- |
Source: Public Records
Mortgage History
| Date | Status | Borrower | Loan Amount |
|---|---|---|---|
| Open | Solomon Carol | $142,661 | |
| Previous Owner | Carriage House Development Inc | $110,400 |
Source: Public Records
Tax History Compared to Growth
Tax History
| Year | Tax Paid | Tax Assessment Tax Assessment Total Assessment is a certain percentage of the fair market value that is determined by local assessors to be the total taxable value of land and additions on the property. | Land | Improvement |
|---|---|---|---|---|
| 2025 | $4,408 | $453,600 | $189,000 | $264,600 |
| 2024 | $4,408 | $424,000 | $182,100 | $241,900 |
| 2023 | $4,408 | $395,800 | $173,400 | $222,400 |
| 2022 | $4,184 | $429,400 | $162,200 | $267,200 |
| 2021 | $3,853 | $306,400 | $103,300 | $203,100 |
| 2019 | $3,278 | $277,600 | $85,400 | $192,200 |
| 2018 | $3,421 | $252,100 | $69,100 | $183,000 |
| 2017 | $3,043 | $216,500 | $55,300 | $161,200 |
| 2016 | $2,646 | $164,000 | $41,400 | $122,600 |
| 2014 | $2,271 | $152,100 | $39,000 | $113,100 |
| 2013 | $2,271 | $132,900 | $34,400 | $98,500 |
Source: Public Records
Map
Nearby Homes