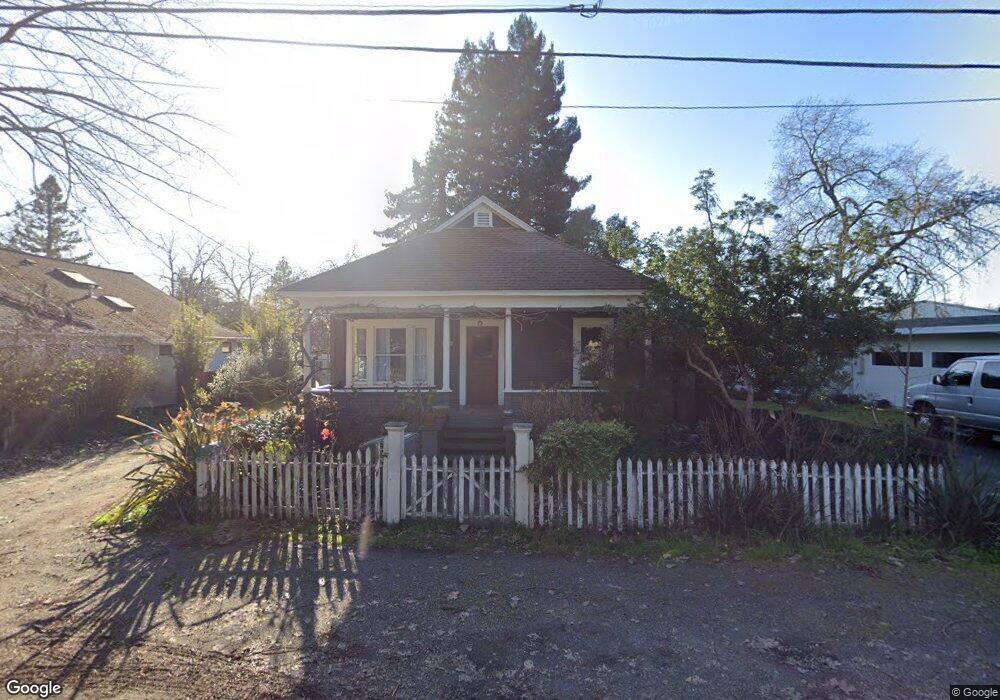
427 Goodman Ave Santa Rosa, CA 95407
Estimated Value: $511,000 - $595,000
2
Beds
2
Baths
1,515
Sq Ft
$367/Sq Ft
Est. Value
About This Home
This home is located at 427 Goodman Ave, Santa Rosa, CA 95407 and is currently estimated at $556,700, approximately $367 per square foot. 427 Goodman Ave is a home located in Sonoma County with nearby schools including Elsie Allen High School, Kid Street Charter School, and St. Michael's Orthodox School.
Ownership History
Date
Name
Owned For
Owner Type
Purchase Details
Closed on
May 17, 2019
Sold by
Fitzpatrick Brian and Miller Sallie Ann
Bought by
Fitzpatrick Brain and Miller Sallie Ann
Current Estimated Value
Home Financials for this Owner
Home Financials are based on the most recent Mortgage that was taken out on this home.
Original Mortgage
$154,300
Outstanding Balance
$100,437
Interest Rate
4.1%
Mortgage Type
New Conventional
Estimated Equity
$456,264
Purchase Details
Closed on
Nov 16, 2001
Sold by
Fitzpatrick Brian
Bought by
Fitzpatrick Brian and Miller Sallie Ann
Purchase Details
Closed on
Feb 27, 2001
Sold by
Wacker Earl and The Earl & Lucille E Wacker 19
Bought by
Fitzpatrick Brian
Home Financials for this Owner
Home Financials are based on the most recent Mortgage that was taken out on this home.
Original Mortgage
$198,000
Interest Rate
6.98%
Create a Home Valuation Report for This Property
The Home Valuation Report is an in-depth analysis detailing your home's value as well as a comparison with similar homes in the area
Purchase History
| Date | Buyer | Sale Price | Title Company |
|---|---|---|---|
| Fitzpatrick Brain | -- | Fidelity National Title | |
| Fitzpatrick Brian | -- | North Bay Title Co | |
| Fitzpatrick Brian | $220,000 | New Century Title Co |
Source: Public Records
Mortgage History
| Date | Status | Borrower | Loan Amount |
|---|---|---|---|
| Open | Fitzpatrick Brain | $154,300 | |
| Closed | Fitzpatrick Brian | $198,000 |
Source: Public Records
Tax History
| Year | Tax Paid | Tax Assessment Tax Assessment Total Assessment is a certain percentage of the fair market value that is determined by local assessors to be the total taxable value of land and additions on the property. | Land | Improvement |
|---|---|---|---|---|
| 2025 | $3,895 | $342,313 | $188,347 | $153,966 |
| 2024 | $3,895 | $335,602 | $184,654 | $150,948 |
| 2023 | $3,895 | $329,023 | $181,034 | $147,989 |
| 2022 | $3,630 | $318,557 | $177,485 | $141,072 |
| 2021 | $3,584 | $312,311 | $174,005 | $138,306 |
| 2020 | $3,490 | $309,109 | $172,221 | $136,888 |
| 2019 | $3,382 | $297,167 | $168,845 | $128,322 |
| 2018 | $3,351 | $291,341 | $165,535 | $125,806 |
| 2017 | $3,280 | $285,630 | $162,290 | $123,340 |
| 2016 | $3,251 | $280,030 | $159,108 | $120,922 |
| 2015 | $3,119 | $275,825 | $156,719 | $119,106 |
| 2014 | $2,595 | $232,000 | $132,000 | $100,000 |
Source: Public Records
Map
Nearby Homes
- 780 Dutton Ave
- 433 Blythewood Place
- 70 Birch Haven Way
- 48 Yarrow Way
- 107 Sebastopol Ave
- 588 Roseland Ave
- 1863 Beachwood Dr
- 497 Sebastopol Ave
- 62 Romani Ct
- 77 Romani Ct
- 0 West Ave Unit 325019616
- 1704 Dutton Ave
- 611 Willrush St
- 303 Boyce St
- 1911 Corby Ave
- 1962 Las Ventanas Dr
- 1964 Las Ventanas Dr
- 101 Colgan Ave Unit 25
- 1215 Rutledge Ave
- 432 8th St
- 433 Goodman Ave
- 425 Goodman Ave
- 437 Goodman Ave
- 421 Goodman Ave
- 443 Goodman Ave
- 434 Goodman Ave
- 415 Goodman Ave
- 426 Goodman Ave
- 422 Goodman Ave
- 440 Goodman Ave
- 584 Dutton Ave
- 451 Goodman Ave
- 418 Goodman Ave
- 430 Goodman Ave
- 654 Dutton Ave
- 450 Goodman Ave
- 568 Dutton Ave
- 454 Goodman Ave
- 457 Goodman Ave
- 606 Dutton Ave
Your Personal Tour Guide
Ask me questions while you tour the home.