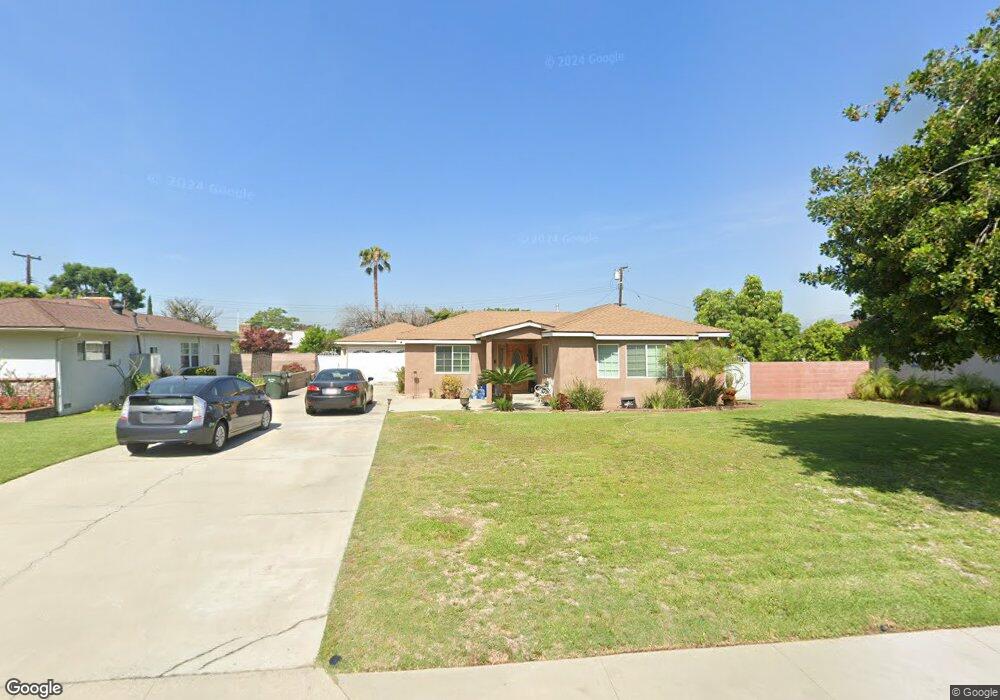
427 N Conlon Ave West Covina, CA 91790
Estimated Value: $863,000 - $928,000
3
Beds
3
Baths
1,638
Sq Ft
$553/Sq Ft
Est. Value
About This Home
This home is located at 427 N Conlon Ave, West Covina, CA 91790 and is currently estimated at $906,405, approximately $553 per square foot. 427 N Conlon Ave is a home located in Los Angeles County with nearby schools including Monte Vista Elementary School, Walnut Grove Intermediate School, and Edgewood High School.
Ownership History
Date
Name
Owned For
Owner Type
Purchase Details
Closed on
Oct 5, 2010
Sold by
U S Bank National Association
Bought by
Estrada Maria Angelica
Current Estimated Value
Home Financials for this Owner
Home Financials are based on the most recent Mortgage that was taken out on this home.
Original Mortgage
$255,500
Outstanding Balance
$168,001
Interest Rate
4.28%
Mortgage Type
New Conventional
Estimated Equity
$738,404
Purchase Details
Closed on
Sep 23, 2009
Sold by
Rodriguez Victor and Rodriguez Maria D
Bought by
Us Bank National Association
Purchase Details
Closed on
May 16, 1994
Sold by
Cooper Titus L and Cooper Irma H
Bought by
Rodriguez Victor
Home Financials for this Owner
Home Financials are based on the most recent Mortgage that was taken out on this home.
Original Mortgage
$180,500
Interest Rate
8.57%
Create a Home Valuation Report for This Property
The Home Valuation Report is an in-depth analysis detailing your home's value as well as a comparison with similar homes in the area
Home Values in the Area
Average Home Value in this Area
Purchase History
| Date | Buyer | Sale Price | Title Company |
|---|---|---|---|
| Estrada Maria Angelica | $350,000 | Lsi Title Agency | |
| Us Bank National Association | $354,151 | Accommodation | |
| Rodriguez Victor | $192,500 | Southland Title |
Source: Public Records
Mortgage History
| Date | Status | Borrower | Loan Amount |
|---|---|---|---|
| Open | Estrada Maria Angelica | $255,500 | |
| Previous Owner | Rodriguez Victor | $180,500 |
Source: Public Records
Tax History Compared to Growth
Tax History
| Year | Tax Paid | Tax Assessment Tax Assessment Total Assessment is a certain percentage of the fair market value that is determined by local assessors to be the total taxable value of land and additions on the property. | Land | Improvement |
|---|---|---|---|---|
| 2025 | $5,707 | $448,400 | $353,343 | $95,057 |
| 2024 | $5,707 | $439,609 | $346,415 | $93,194 |
| 2023 | $5,428 | $430,990 | $339,623 | $91,367 |
| 2022 | $5,472 | $422,540 | $332,964 | $89,576 |
| 2021 | $5,319 | $414,256 | $326,436 | $87,820 |
| 2019 | $5,179 | $401,970 | $316,754 | $85,216 |
| 2018 | $4,906 | $394,090 | $310,544 | $83,546 |
| 2016 | $4,488 | $378,788 | $298,486 | $80,302 |
| 2015 | $4,398 | $373,099 | $294,003 | $79,096 |
| 2014 | $4,374 | $365,791 | $288,244 | $77,547 |
Source: Public Records
Map
Nearby Homes
- 434 N Orange Ave
- 537 N Yaleton Ave
- 1908 W Thelborn St
- 1553 Dennis Place
- 154 N Roberto Ave
- 1814 Seattle St
- 631 N La Sena Ave
- 557 N Broadmoor Ave
- 427 N Walnuthaven Dr
- 750 N Sunset Ave
- 3773 Mayland Ave
- 1811 David Ct
- 1736 Cayton Loop
- 1752 Cayton Loop
- 14881 Clydewood St
- 1626 Cayton Loop
- 104 Poxon Place
- 120 Poxon Place
- 1005 W Greendale St
- 218 Lockhart Way
- 433 N Conlon Ave
- 421 N Conlon Ave
- 426 N Lang Ave
- 434 N Lang Ave
- 422 N Lang Ave
- 419 N Conlon Ave
- 426 N Conlon Ave
- 430 N Conlon Ave
- 422 N Conlon Ave
- 434 N Conlon Ave
- 420 N Lang Ave
- 1609 W Howellhurst Dr
- 1603 W Howellhurst Dr
- 420 N Conlon Ave
- 1615 W Howellhurst Dr
- 417 N Conlon Ave
- 502 N Conlon Ave
- 1621 W Howellhurst Dr
- 416 N Lang Ave
- 418 N Conlon Ave