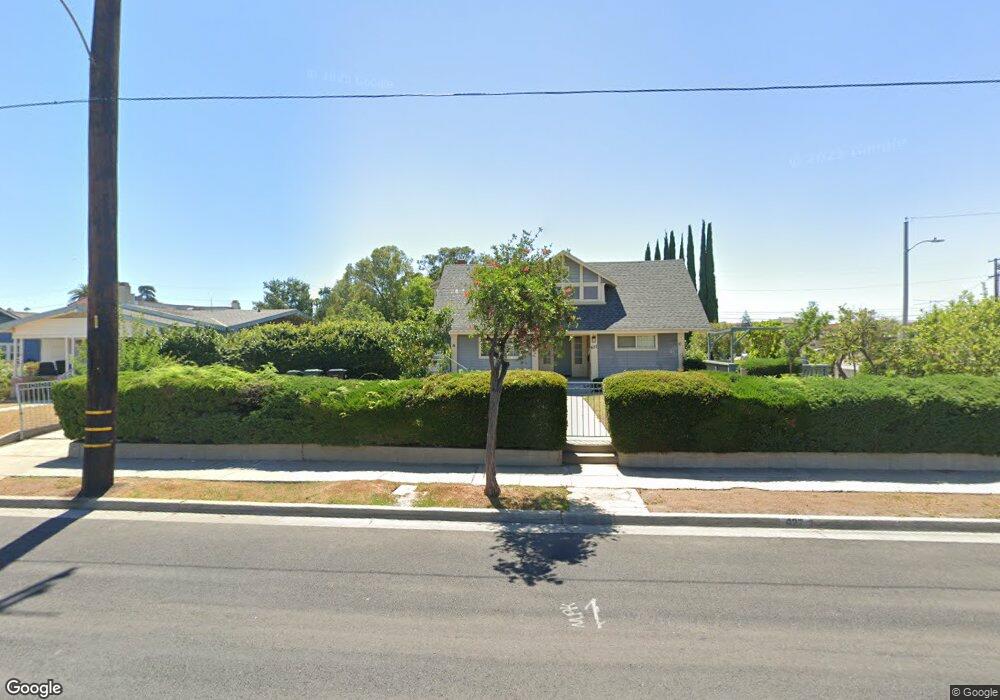
427 N Mcpherrin Ave Unit B Monterey Park, CA 91754
Estimated Value: $1,435,000 - $2,167,000
5
Beds
3
Baths
2,586
Sq Ft
$670/Sq Ft
Est. Value
About This Home
This home is located at 427 N Mcpherrin Ave Unit B, Monterey Park, CA 91754 and is currently estimated at $1,732,028, approximately $669 per square foot. 427 N Mcpherrin Ave Unit B is a home located in Los Angeles County with nearby schools including Ynez Elementary School, Mark Keppel High School, and St. Stephen Martyr School.
Ownership History
Date
Name
Owned For
Owner Type
Purchase Details
Closed on
May 21, 2020
Sold by
Chau Wai Fan
Bought by
Yatso Chau Llc
Current Estimated Value
Home Financials for this Owner
Home Financials are based on the most recent Mortgage that was taken out on this home.
Original Mortgage
$360,000
Outstanding Balance
$284,597
Interest Rate
3.3%
Mortgage Type
New Conventional
Estimated Equity
$1,447,431
Purchase Details
Closed on
Apr 7, 2020
Sold by
Equity Trust Company
Bought by
Chau Wai Fan
Home Financials for this Owner
Home Financials are based on the most recent Mortgage that was taken out on this home.
Original Mortgage
$360,000
Outstanding Balance
$284,597
Interest Rate
3.3%
Mortgage Type
New Conventional
Estimated Equity
$1,447,431
Purchase Details
Closed on
Oct 11, 2017
Sold by
Seow Oon A
Bought by
Sheng Wah T
Purchase Details
Closed on
Sep 27, 2017
Sold by
Yu Jui Tun
Bought by
Equity Trust Company and Oon A Seow Ira
Create a Home Valuation Report for This Property
The Home Valuation Report is an in-depth analysis detailing your home's value as well as a comparison with similar homes in the area
Home Values in the Area
Average Home Value in this Area
Purchase History
| Date | Buyer | Sale Price | Title Company |
|---|---|---|---|
| Yatso Chau Llc | -- | Accommodation | |
| Chau Wai Fan | $1,328,000 | Fidelity National Title Co | |
| Sheng Wah T | -- | Wfg National Title Company | |
| Seow Oon A | -- | Wfg National Title Company | |
| Equity Trust Company | $1,172,000 | Wfg National Title Company |
Source: Public Records
Mortgage History
| Date | Status | Borrower | Loan Amount |
|---|---|---|---|
| Open | Chau Wai Fan | $360,000 |
Source: Public Records
Tax History Compared to Growth
Tax History
| Year | Tax Paid | Tax Assessment Tax Assessment Total Assessment is a certain percentage of the fair market value that is determined by local assessors to be the total taxable value of land and additions on the property. | Land | Improvement |
|---|---|---|---|---|
| 2025 | $18,874 | $1,452,360 | $929,598 | $522,762 |
| 2024 | $18,874 | $1,423,883 | $911,371 | $512,512 |
| 2023 | $18,496 | $1,395,964 | $893,501 | $502,463 |
| 2022 | $17,619 | $1,368,593 | $875,982 | $492,611 |
| 2021 | $17,417 | $1,341,758 | $858,806 | $482,952 |
| 2020 | $15,969 | $1,219,348 | $624,240 | $595,108 |
| 2019 | $15,489 | $1,195,440 | $612,000 | $583,440 |
| 2018 | $15,486 | $1,172,000 | $600,000 | $572,000 |
| 2016 | $7,724 | $587,451 | $292,171 | $295,280 |
| 2015 | $7,604 | $578,628 | $287,783 | $290,845 |
| 2014 | $7,511 | $567,294 | $282,146 | $285,148 |
Source: Public Records
Map
Nearby Homes
- 513 W Emerson Ave Unit C
- 500 N Moore Ave Unit E
- 516 N Moore Ave Unit A
- 215 W Garcelon Ave
- 305 N Baltimore Ave Unit C
- 2037 S 3rd St
- 419 N Chandler Ave Unit 508
- 419 N Chandler Ave Unit 311
- 419 N Chandler Ave Unit 308
- 419 N Chandler Ave Unit 413
- 419 N Chandler Ave Unit 305
- 419 N Chandler Ave Unit 319
- 612 W Ramona Rd
- 600 N Atlantic Blvd Unit 516
- 600 N Atlantic Blvd Unit 508
- 600 N Atlantic Blvd Unit 207
- 0 N Atlantic Blvd Unit WS23107010
- 406 N Lincoln Ave Unit A
- 125 S Moore Ave Unit 2
- 215 N Lincoln Ave
- 427 N Mc Pherrin Ave
- 427 N Mcpherrin Ave
- 427 N Mcpherrin Ave
- 414 Hilliard Ave
- 423 N Mcpherrin Ave
- 416 Hilliard Ave
- 421 N Mcpherrin Ave
- 501 N Mcpherrin Ave
- 411 Hilliard Ave
- 418 Hilliard Ave
- 415 N Mcpherrin Ave Unit 1
- 505 N Mcpherrin Ave
- 426 N Mcpherrin Ave
- 415 Hilliard Ave
- 417 N Mcpherrin Ave Unit B
- 417 N Mcpherrin Ave Unit A
- 407 N Mcpherrin Ave
- 500 N Mcpherrin Ave
- 417 Hilliard Ave
- 420 N Mcpherrin Ave