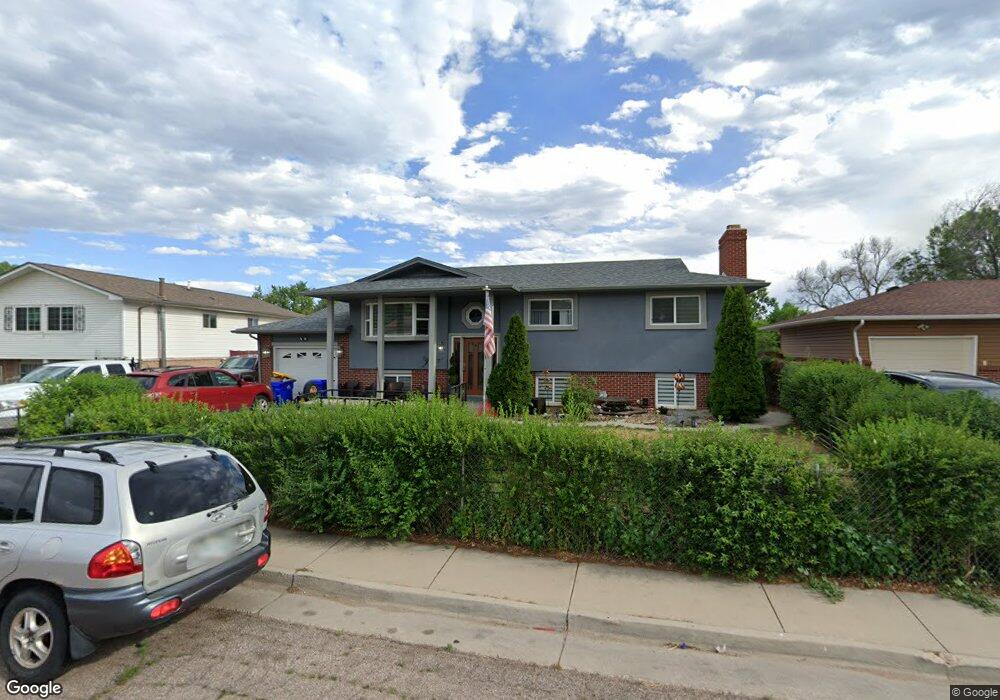
427 Niagara St Colorado Springs, CO 80911
Widefield NeighborhoodEstimated Value: $349,524 - $407,000
4
Beds
2
Baths
1,126
Sq Ft
$334/Sq Ft
Est. Value
About This Home
This home is located at 427 Niagara St, Colorado Springs, CO 80911 and is currently estimated at $376,631, approximately $334 per square foot. 427 Niagara St is a home located in El Paso County with nearby schools including Talbott STEAM Innovation School, Watson Junior High School, and Mesa Ridge High School.
Ownership History
Date
Name
Owned For
Owner Type
Purchase Details
Closed on
Feb 25, 2002
Sold by
Aguon Ursula R and Aguon Frankie S
Bought by
Clair Norma I and Clair David C
Current Estimated Value
Home Financials for this Owner
Home Financials are based on the most recent Mortgage that was taken out on this home.
Original Mortgage
$112,000
Outstanding Balance
$45,962
Interest Rate
6.81%
Estimated Equity
$330,669
Purchase Details
Closed on
Nov 22, 1996
Sold by
Bryant Douglas C and Bryant Patricia D
Bought by
Aguon Ursula R and Aguon Frankie S
Home Financials for this Owner
Home Financials are based on the most recent Mortgage that was taken out on this home.
Original Mortgage
$101,700
Interest Rate
7.84%
Purchase Details
Closed on
Mar 1, 1986
Bought by
Clair David C
Create a Home Valuation Report for This Property
The Home Valuation Report is an in-depth analysis detailing your home's value as well as a comparison with similar homes in the area
Home Values in the Area
Average Home Value in this Area
Purchase History
| Date | Buyer | Sale Price | Title Company |
|---|---|---|---|
| Clair Norma I | $140,000 | -- | |
| Aguon Ursula R | $113,000 | Stewart Title | |
| Clair David C | -- | -- |
Source: Public Records
Mortgage History
| Date | Status | Borrower | Loan Amount |
|---|---|---|---|
| Open | Clair Norma I | $112,000 | |
| Previous Owner | Aguon Ursula R | $101,700 |
Source: Public Records
Tax History Compared to Growth
Tax History
| Year | Tax Paid | Tax Assessment Tax Assessment Total Assessment is a certain percentage of the fair market value that is determined by local assessors to be the total taxable value of land and additions on the property. | Land | Improvement |
|---|---|---|---|---|
| 2025 | $1,682 | $26,700 | -- | -- |
| 2024 | $1,628 | $27,730 | $4,820 | $22,910 |
| 2023 | $1,628 | $27,730 | $4,820 | $22,910 |
| 2022 | $1,354 | $19,420 | $3,410 | $16,010 |
| 2021 | $1,464 | $19,970 | $3,500 | $16,470 |
| 2020 | $1,183 | $15,810 | $3,070 | $12,740 |
| 2019 | $1,175 | $15,810 | $3,070 | $12,740 |
| 2018 | $1,024 | $12,910 | $2,340 | $10,570 |
| 2017 | $1,036 | $12,910 | $2,340 | $10,570 |
| 2016 | $804 | $12,460 | $2,390 | $10,070 |
| 2015 | $827 | $12,460 | $2,390 | $10,070 |
| 2014 | $763 | $11,600 | $2,390 | $9,210 |
Source: Public Records
Map
Nearby Homes
- 538 Bickley St
- 154 Kilgore St
- 146 Kilgore St
- 614 Bickley St
- 502 Dexter St
- 132 Kilgore St
- 245 Dexter St
- 475 Cielo Vista St
- 251 Fay Dr
- 318 Cielo Vista St
- 206 Cielo Vista St
- 196 Jersey Ln
- 223 Jersey Ln
- 648 Syracuse St
- 114 Kokomo St
- 125 Ithaca St
- 676 Fay Dr
- 128 Ithaca St
- 125 Harvard St
- 7005 Metropolitan St