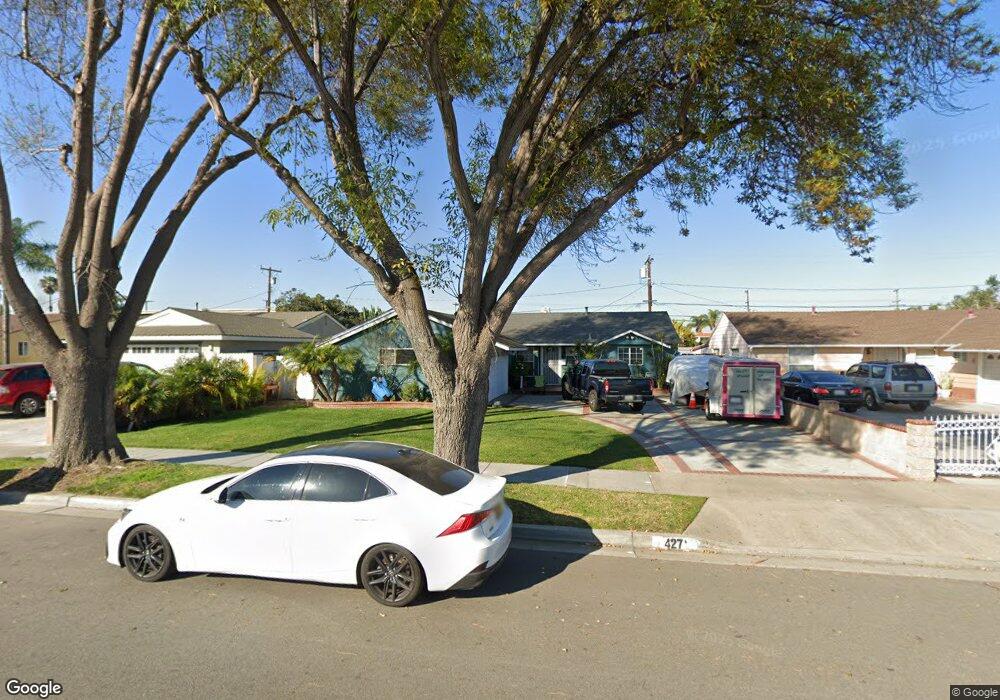
427 S Laxore St Anaheim, CA 92804
West Anaheim NeighborhoodEstimated Value: $859,489 - $1,052,000
3
Beds
2
Baths
1,109
Sq Ft
$827/Sq Ft
Est. Value
About This Home
This home is located at 427 S Laxore St, Anaheim, CA 92804 and is currently estimated at $916,872, approximately $826 per square foot. 427 S Laxore St is a home located in Orange County with nearby schools including Dr. Albert Schweitzer Elementary School, Dale Jr High School, and Magnolia High.
Ownership History
Date
Name
Owned For
Owner Type
Purchase Details
Closed on
Sep 30, 2021
Sold by
Velazquez Gonzalo
Bought by
Velazquez Gonzalo and Velazquez Vanessa
Current Estimated Value
Purchase Details
Closed on
Jul 17, 2008
Sold by
Velazquez Gonzalo and Velazquez Maria C
Bought by
Velazquez Gonzalo
Home Financials for this Owner
Home Financials are based on the most recent Mortgage that was taken out on this home.
Original Mortgage
$272,000
Outstanding Balance
$177,598
Interest Rate
6.31%
Mortgage Type
New Conventional
Estimated Equity
$739,274
Purchase Details
Closed on
Dec 27, 1993
Sold by
Garnett Dennis P
Bought by
Velazquez Gonzalo and Velazquez Maria C
Home Financials for this Owner
Home Financials are based on the most recent Mortgage that was taken out on this home.
Original Mortgage
$149,144
Interest Rate
7.09%
Mortgage Type
FHA
Create a Home Valuation Report for This Property
The Home Valuation Report is an in-depth analysis detailing your home's value as well as a comparison with similar homes in the area
Home Values in the Area
Average Home Value in this Area
Purchase History
| Date | Buyer | Sale Price | Title Company |
|---|---|---|---|
| Velazquez Gonzalo | -- | None Available | |
| Velazquez Gonzalo | -- | Ticor Title Orange | |
| Velazquez Gonzalo | $151,000 | Gateway Title Company |
Source: Public Records
Mortgage History
| Date | Status | Borrower | Loan Amount |
|---|---|---|---|
| Open | Velazquez Gonzalo | $272,000 | |
| Closed | Velazquez Gonzalo | $149,144 |
Source: Public Records
Tax History Compared to Growth
Tax History
| Year | Tax Paid | Tax Assessment Tax Assessment Total Assessment is a certain percentage of the fair market value that is determined by local assessors to be the total taxable value of land and additions on the property. | Land | Improvement |
|---|---|---|---|---|
| 2025 | $3,033 | $256,468 | $178,727 | $77,741 |
| 2024 | $3,033 | $251,440 | $175,223 | $76,217 |
| 2023 | $2,952 | $246,510 | $171,787 | $74,723 |
| 2022 | $2,919 | $241,677 | $168,419 | $73,258 |
| 2021 | $2,882 | $236,939 | $165,117 | $71,822 |
| 2020 | $2,865 | $234,510 | $163,424 | $71,086 |
| 2019 | $2,797 | $229,912 | $160,219 | $69,693 |
| 2018 | $2,762 | $225,404 | $157,077 | $68,327 |
| 2017 | $2,666 | $220,985 | $153,997 | $66,988 |
| 2016 | $2,651 | $216,652 | $150,977 | $65,675 |
| 2015 | $2,627 | $213,398 | $148,709 | $64,689 |
| 2014 | $2,498 | $209,218 | $145,796 | $63,422 |
Source: Public Records
Map
Nearby Homes
- 2945 W Bridgeport Ave
- 2942 W Floyd Ave
- 235 S Beach Blvd Unit 132
- 211 S Beach Blvd Unit 92
- 612 S Halliday St
- 716 S Hayward St Unit 2
- 103 S Laxore St
- 106 S Laxore St Unit 407
- 107 S Laxore St
- Plan Two at Mason
- Plan Four at Mason
- Plan Three at Mason
- 109 S Laxore St
- 2943 W Lincoln Ave
- 507 S Shields Dr
- 900 S Hayward St
- 3115 W Teranimar Dr
- 619 S Shields Dr
- 2770 W Lincoln Ave Unit 29A
- 2770 W Lincoln Ave Unit 40
- 431 S Laxore St
- 423 S Laxore St
- 435 S Laxore St
- 419 S Laxore St
- 2960 W Rowland Cir
- 2961 W Bridgeport Ave
- 501 S Laxore St
- 415 S Laxore St
- 2957 W Bridgeport Ave
- 2956 W Rowland Cir
- 411 S Laxore St
- 505 S Laxore St
- 2961 W Rowland Cir
- 2960 W Bridgeport Ave
- 2953 W Bridgeport Ave
- 2952 W Rowland Cir
- 407 S Laxore St
- 509 S Laxore St
- 2957 W Rowland Cir
- 2956 W Bridgeport Ave