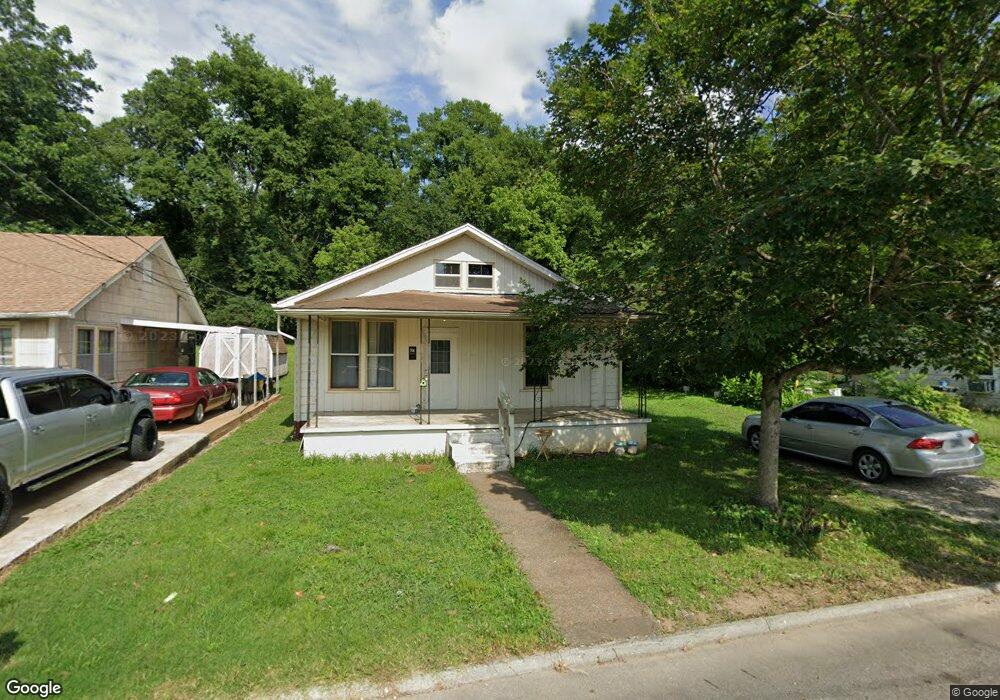
427 Spofford St Pulaski, TN 38478
Estimated Value: $27,491 - $155,000
--
Bed
1
Bath
1,026
Sq Ft
$113/Sq Ft
Est. Value
About This Home
This home is located at 427 Spofford St, Pulaski, TN 38478 and is currently estimated at $115,873, approximately $112 per square foot. 427 Spofford St is a home located in Giles County with nearby schools including Pulaski Elementary School, Southside Elementary School, and Bridgeforth Middle School.
Ownership History
Date
Name
Owned For
Owner Type
Purchase Details
Closed on
Nov 30, 2023
Sold by
Henson Edward P and Henson Edward Keith
Bought by
Edward P Henson Income Only Trust and Henson
Current Estimated Value
Purchase Details
Closed on
Oct 31, 2013
Sold by
Poling Debra
Bought by
Henson Edward P and Henson Edward Keith
Purchase Details
Closed on
Nov 25, 1998
Sold by
Robert Poling P
Bought by
Poling P Robert
Purchase Details
Closed on
May 15, 1995
Sold by
Tenn Housing Development
Bought by
King Paul Lynn and King Jennifer
Purchase Details
Closed on
Jan 9, 1995
Bought by
Sec Of Housing & Urban Dev
Purchase Details
Closed on
Mar 26, 1992
Bought by
Martin O V Mary C
Purchase Details
Closed on
Aug 1, 1989
Bought by
Watson Lee Roy and Watson Dorothy M
Purchase Details
Closed on
Nov 1, 1985
Bought by
Hamby Joey and Hamby Linda
Create a Home Valuation Report for This Property
The Home Valuation Report is an in-depth analysis detailing your home's value as well as a comparison with similar homes in the area
Home Values in the Area
Average Home Value in this Area
Purchase History
| Date | Buyer | Sale Price | Title Company |
|---|---|---|---|
| Edward P Henson Income Only Trust | -- | None Listed On Document | |
| Edward P Henson Income Only Trust | -- | None Listed On Document | |
| Henson Edward P | $10,670 | -- | |
| Poling P Robert | $30,000 | -- | |
| King Paul Lynn | $31,000 | -- | |
| Sec Of Housing & Urban Dev | $32,200 | -- | |
| Martin O V Mary C | -- | -- | |
| Watson Lee Roy | -- | -- | |
| Hamby Joey | -- | -- |
Source: Public Records
Tax History Compared to Growth
Tax History
| Year | Tax Paid | Tax Assessment Tax Assessment Total Assessment is a certain percentage of the fair market value that is determined by local assessors to be the total taxable value of land and additions on the property. | Land | Improvement |
|---|---|---|---|---|
| 2025 | $480 | $19,950 | $0 | $0 |
| 2024 | $480 | $19,950 | $2,800 | $17,150 |
| 2023 | $480 | $19,950 | $2,800 | $17,150 |
| 2022 | $480 | $19,950 | $2,800 | $17,150 |
| 2021 | $305 | $9,000 | $1,500 | $7,500 |
| 2020 | $305 | $9,000 | $1,500 | $7,500 |
| 2019 | $254 | $9,000 | $1,500 | $7,500 |
| 2018 | $305 | $9,000 | $1,500 | $7,500 |
| 2017 | $305 | $9,000 | $1,500 | $7,500 |
| 2016 | $292 | $8,250 | $1,500 | $6,750 |
| 2015 | $276 | $8,250 | $1,500 | $6,750 |
| 2014 | $276 | $8,250 | $0 | $0 |
Source: Public Records
Map
Nearby Homes
- 303 Magazine Rd
- 311 S 1st St
- 602 S 1st St
- 118 S Rhodes St
- 439 E Madison St
- 523 Highland Ave
- 534 E College St
- 513 S 4th St
- 527 E Madison St
- 515 S Cedar Ln
- 635 Cleveland St Unit 637
- 134 Elm St
- 318 W Jefferson St
- 1 Magazine Rd
- 116 E Woodring St
- 207 N Cedar Ln
- 403 Victoria St
- 321 W Washington St
- 418 Jones St
- 415 S Ingram St
- 423 Spofford St
- 433 Spofford St
- 419 Spofford St
- 503 Spofford St
- 424 S Rhodes St
- 420 S Rhodes St
- 430 S Rhodes St
- 415 Spofford St
- 418 S Rhodes St
- 505 Spofford St
- 502 S Rhodes St
- 411 Spofford St
- 237 Stadium St
- 511 Spofford St
- 243 Stadium St
- 229 Stadium St
- 508 S Rhodes St
- 249 Stadium St
- 249 Stadium St
- 517 Spofford St