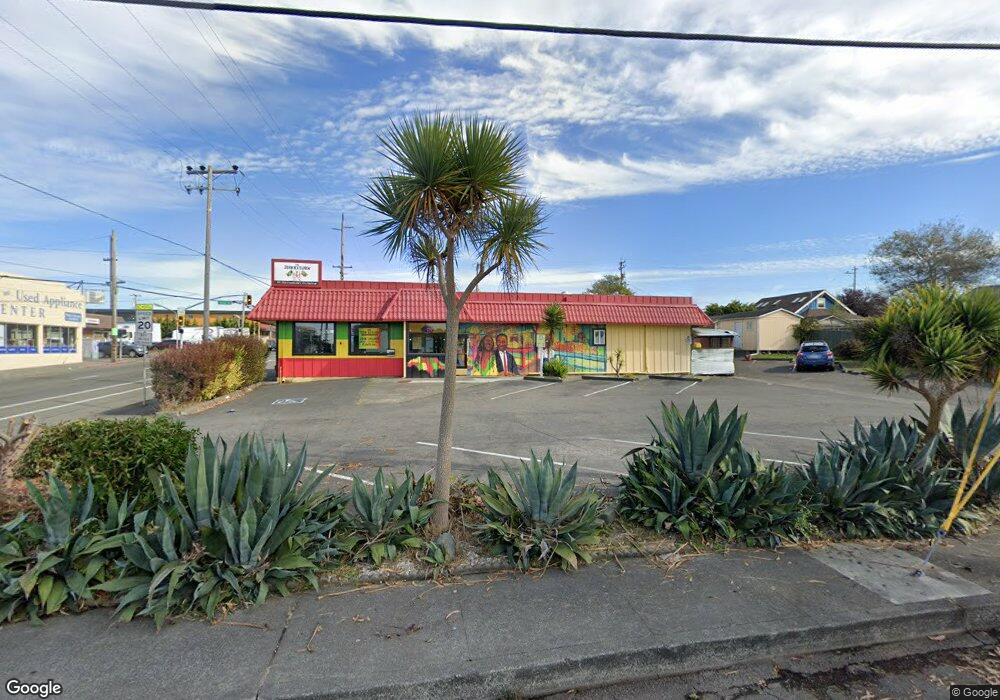
427 W Harris St Eureka, CA 95503
Rosewood NeighborhoodEstimated Value: $734,165
Studio
2
Baths
2,212
Sq Ft
$332/Sq Ft
Est. Value
About This Home
This home is located at 427 W Harris St, Eureka, CA 95503 and is currently estimated at $734,165, approximately $331 per square foot. 427 W Harris St is a home located in Humboldt County with nearby schools including Alice Birney Elementary School, Winship Middle School, and Eureka Senior High School.
Ownership History
Date
Name
Owned For
Owner Type
Purchase Details
Closed on
Sep 1, 2020
Sold by
Foreclosure Specialists
Bought by
Omey Lisa Marie
Current Estimated Value
Purchase Details
Closed on
Aug 22, 2017
Sold by
Pimentel Elias A and Pimentel Rita
Bought by
Pimentel Elias A and Pimentel Rita J
Purchase Details
Closed on
Dec 1, 2008
Sold by
Lopez Roberto
Bought by
Pimentel Rita
Home Financials for this Owner
Home Financials are based on the most recent Mortgage that was taken out on this home.
Original Mortgage
$200,000
Interest Rate
6.47%
Mortgage Type
Commercial
Purchase Details
Closed on
Nov 12, 2003
Sold by
Pimentel Elias A
Bought by
Pimentel Rita
Purchase Details
Closed on
Apr 12, 2001
Sold by
National North Coast Corp
Bought by
Pimentel Elias A and Pimentel Rita
Home Financials for this Owner
Home Financials are based on the most recent Mortgage that was taken out on this home.
Original Mortgage
$190,000
Interest Rate
7.15%
Mortgage Type
Commercial
Create a Home Valuation Report for This Property
The Home Valuation Report is an in-depth analysis detailing your home's value as well as a comparison with similar homes in the area
Home Values in the Area
Average Home Value in this Area
Purchase History
| Date | Buyer | Sale Price | Title Company |
|---|---|---|---|
| Omey Lisa Marie | $232,923 | First American Title | |
| Pimentel Elias A | -- | None Available | |
| Pimentel Rita | -- | Humboldt Land Title Company | |
| Pimentel Rita | -- | -- | |
| Pimentel Elias A | $200,000 | Fidelity National Title Co |
Source: Public Records
Mortgage History
| Date | Status | Borrower | Loan Amount |
|---|---|---|---|
| Previous Owner | Pimentel Rita | $200,000 | |
| Previous Owner | Pimentel Elias A | $190,000 |
Source: Public Records
Tax History
| Year | Tax Paid | Tax Assessment Tax Assessment Total Assessment is a certain percentage of the fair market value that is determined by local assessors to be the total taxable value of land and additions on the property. | Land | Improvement |
|---|---|---|---|---|
| 2025 | $4,453 | $432,972 | $162,364 | $270,608 |
| 2024 | $4,453 | $295,436 | $110,785 | $184,651 |
| 2023 | $3,056 | $289,644 | $108,613 | $181,031 |
| 2022 | $3,172 | $283,966 | $106,484 | $177,482 |
| 2021 | $3,118 | $278,399 | $104,397 | $174,002 |
| 2020 | $3,388 | $286,545 | $103,327 | $183,218 |
| 2019 | $4,312 | $281,143 | $101,301 | $179,842 |
| 2018 | $7,149 | $302,247 | $99,315 | $202,932 |
| 2017 | $6,879 | $297,055 | $97,368 | $199,687 |
| 2016 | $6,759 | $291,786 | $95,459 | $196,327 |
| 2015 | $6,529 | $287,964 | $94,026 | $193,938 |
| 2014 | $2,941 | $275,609 | $92,185 | $183,424 |
Source: Public Records
Map
Nearby Homes
- 318 W Harris St
- 3440 Elizabeth St
- 2950 California St
- 3402 California St
- 3124 Ingley St
- 2613 Spring St
- 2533 Garland St
- 3570 Albee St
- 136 Randolph St
- 3206 Lowell St
- 3324 Lowell St
- 3512 Glen St
- 3615 Glen St
- 2850 D St
- 1201 Allard Ave Unit 10G
- 3782 Little Fairfield St
- 2135 California St
- 2036 Albee St
- 318 Long St
- 2105 A St
- 3123 Albee St
- 503 W Harris St
- 3112 Union St
- 3120 Union St
- 424 W Everding St
- 400 W Harris St
- 402 W Harris St
- 401 W Harris St
- 426 W Harris St
- 3138 Albee St
- 511 W Harris St
- 414 W Harris St
- 3140 Union St
- 3029 Albee St
- 525 W Harris St
- 3019 Albee St
- 2964 Union St
- 3205 Albee St
- 520 W Everding St
- 309 W Harris St