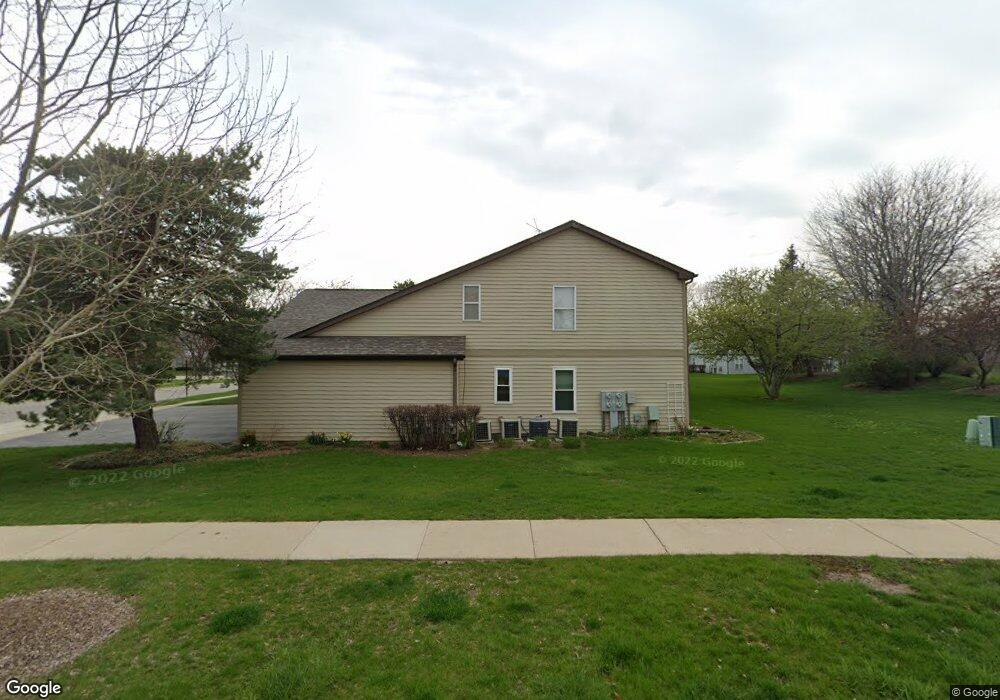
427 Woodview Cir Unit 12B12 Elgin, IL 60120
Bluff City NeighborhoodEstimated Value: $230,705 - $265,000
2
Beds
--
Bath
1,100
Sq Ft
$223/Sq Ft
Est. Value
About This Home
This home is located at 427 Woodview Cir Unit 12B12, Elgin, IL 60120 and is currently estimated at $245,426, approximately $223 per square foot. 427 Woodview Cir Unit 12B12 is a home located in Cook County with nearby schools including Hilltop Elementary School, Ellis Middle School, and Elgin High School.
Ownership History
Date
Name
Owned For
Owner Type
Purchase Details
Closed on
Feb 11, 2025
Sold by
Moaddel Marjan
Bought by
Marjan Moaddel 2025 Trust and Moaddel
Current Estimated Value
Purchase Details
Closed on
Jul 3, 2023
Sold by
Hansa-Om Carole
Bought by
Moaddel Marjan
Purchase Details
Closed on
Nov 6, 2018
Sold by
Clark Dale and Malagon Jaquelina
Bought by
Hallstrom Carole
Purchase Details
Closed on
Aug 14, 2009
Sold by
Clark Thomas
Bought by
Clark Dale
Purchase Details
Closed on
Aug 7, 2009
Sold by
Clark William
Bought by
Clark Dale
Purchase Details
Closed on
May 12, 1995
Sold by
Parkway Bank & Trust Company
Bought by
Stetz Daniel E and Stetz Christine R
Home Financials for this Owner
Home Financials are based on the most recent Mortgage that was taken out on this home.
Original Mortgage
$82,100
Interest Rate
8.26%
Create a Home Valuation Report for This Property
The Home Valuation Report is an in-depth analysis detailing your home's value as well as a comparison with similar homes in the area
Home Values in the Area
Average Home Value in this Area
Purchase History
| Date | Buyer | Sale Price | Title Company |
|---|---|---|---|
| Marjan Moaddel 2025 Trust | -- | None Listed On Document | |
| Moaddel Marjan | $205,000 | Fidelity National Title Compan | |
| Hallstrom Carole | $115,000 | Chicago Title | |
| Clark Dale | -- | None Available | |
| Clark Dale | -- | None Available | |
| Stetz Daniel E | $86,500 | First American Title |
Source: Public Records
Mortgage History
| Date | Status | Borrower | Loan Amount |
|---|---|---|---|
| Previous Owner | Stetz Daniel E | $82,100 |
Source: Public Records
Tax History Compared to Growth
Tax History
| Year | Tax Paid | Tax Assessment Tax Assessment Total Assessment is a certain percentage of the fair market value that is determined by local assessors to be the total taxable value of land and additions on the property. | Land | Improvement |
|---|---|---|---|---|
| 2024 | $2,266 | $13,840 | $1,992 | $11,848 |
| 2023 | $2,149 | $13,840 | $1,992 | $11,848 |
| 2022 | $2,149 | $13,840 | $1,992 | $11,848 |
| 2021 | $1,201 | $9,479 | $1,609 | $7,870 |
| 2020 | $1,334 | $9,479 | $1,609 | $7,870 |
| 2019 | $1,371 | $10,645 | $1,609 | $9,036 |
| 2018 | $2,592 | $7,628 | $1,379 | $6,249 |
| 2017 | $2,584 | $7,628 | $1,379 | $6,249 |
| 2016 | $2,431 | $7,628 | $1,379 | $6,249 |
| 2015 | $2,411 | $6,861 | $1,225 | $5,636 |
| 2014 | $2,335 | $6,861 | $1,225 | $5,636 |
| 2013 | $2,258 | $6,861 | $1,225 | $5,636 |
Source: Public Records
Map
Nearby Homes
- 310 Buckingham Cir Unit B
- 1023 Berkshire Ct Unit C
- 1107 Yorkshire Ct Unit B
- 445 Lucile Ave
- 1002 Bruce Dr
- 1373 Cimarron Ct Unit 49
- 1292 Inverness Dr
- 520 Aller Ave
- 149 Highbury Dr
- 536 Aller Ave
- 700 Mariner Dr
- 1256 Concord Dr
- 1087 Houston Ave
- 130 Stonehurst Dr
- 1366 Inverness Dr
- 1320 Aspen Ct
- 821 Bode Rd Unit 15
- 821 Bode Rd Unit 12
- 26 Glen Echo Rd
- 764 Terrace Ct Unit A
- 427 Woodview Cir Unit B
- 427 Woodview Cir Unit 12B22
- 427 Woodview Cir Unit 12A22
- 427 Woodview Cir Unit 12A12
- 427 Woodview Cir Unit D
- 427 Woodview Cir Unit C
- 427 Woodview Cir Unit A
- 425 Woodview Cir Unit 12A21
- 425 Woodview Cir Unit 12B21
- 425 Woodview Cir Unit 12B11
- 425 Woodview Cir Unit 12A11
- 425 Woodview Cir Unit C
- 425 Woodview Cir Unit D
- 425 Woodview Cir Unit A
- 330 Buckingham Cir Unit 6A
- 330 Buckingham Cir Unit 6A
- 330 Buckingham Cir Unit 6A
- 330 Buckingham Cir Unit 6A
- 330 Buckingham Cir Unit A
- 330 Buckingham Cir Unit D