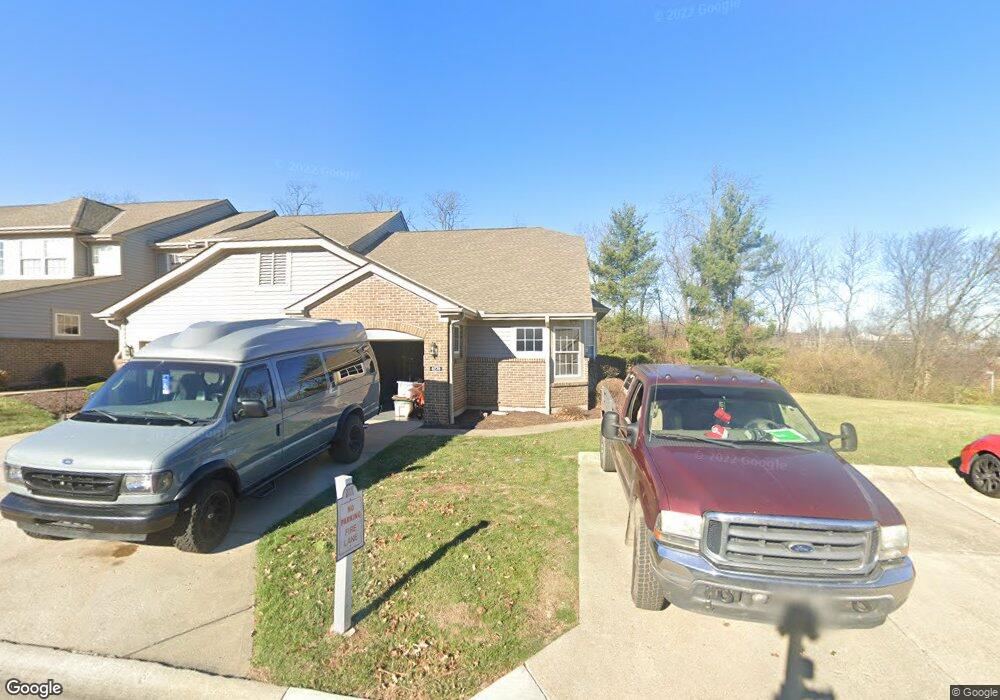
4270 Intrepid Dr Unit 6 Cincinnati, OH 45252
Estimated Value: $287,000 - $354,908
2
Beds
2
Baths
1,367
Sq Ft
$239/Sq Ft
Est. Value
About This Home
This home is located at 4270 Intrepid Dr Unit 6, Cincinnati, OH 45252 and is currently estimated at $326,227, approximately $238 per square foot. 4270 Intrepid Dr Unit 6 is a home located in Hamilton County with nearby schools including Colerain Elementary School, Colerain Middle School, and Colerain High School.
Ownership History
Date
Name
Owned For
Owner Type
Purchase Details
Closed on
Sep 27, 2024
Sold by
Sumner Christopher and Sumner Corinne
Bought by
Piatt Eydie
Current Estimated Value
Purchase Details
Closed on
Sep 17, 2018
Sold by
Spellmeyer Carole A
Bought by
Sumner Noble Ray and Sumner Patricia L
Home Financials for this Owner
Home Financials are based on the most recent Mortgage that was taken out on this home.
Original Mortgage
$157,000
Interest Rate
4.75%
Mortgage Type
Adjustable Rate Mortgage/ARM
Purchase Details
Closed on
Nov 30, 2001
Sold by
Spellmeyer Richard H and Spellmeyer Carole A
Bought by
Spellmeyer Richard H and Spellmeyer Carole A
Purchase Details
Closed on
Aug 27, 2001
Sold by
Willke H Alois Trust and Goeke Mary Goeke
Bought by
Spellmeyer Richard H and Spellmeyer Carole A
Home Financials for this Owner
Home Financials are based on the most recent Mortgage that was taken out on this home.
Original Mortgage
$128,000
Interest Rate
5.99%
Create a Home Valuation Report for This Property
The Home Valuation Report is an in-depth analysis detailing your home's value as well as a comparison with similar homes in the area
Home Values in the Area
Average Home Value in this Area
Purchase History
| Date | Buyer | Sale Price | Title Company |
|---|---|---|---|
| Piatt Eydie | $370,000 | None Listed On Document | |
| Sumner Noble Ray | $197,000 | Prominent Title Agency Llc | |
| Spellmeyer Richard H | -- | -- | |
| Spellmeyer Richard H | $160,000 | Vintage Title Agency Inc |
Source: Public Records
Mortgage History
| Date | Status | Borrower | Loan Amount |
|---|---|---|---|
| Previous Owner | Sumner Noble Ray | $157,000 | |
| Previous Owner | Spellmeyer Richard H | $128,000 |
Source: Public Records
Tax History
| Year | Tax Paid | Tax Assessment Tax Assessment Total Assessment is a certain percentage of the fair market value that is determined by local assessors to be the total taxable value of land and additions on the property. | Land | Improvement |
|---|---|---|---|---|
| 2025 | $5,179 | $90,080 | $10,500 | $79,580 |
| 2023 | $4,993 | $90,080 | $10,500 | $79,580 |
| 2022 | $4,671 | $68,950 | $8,750 | $60,200 |
| 2021 | $4,717 | $68,950 | $8,750 | $60,200 |
| 2020 | $4,660 | $68,950 | $8,750 | $60,200 |
| 2019 | $3,999 | $54,922 | $8,750 | $46,172 |
| 2018 | $3,597 | $54,922 | $8,750 | $46,172 |
| 2017 | $3,455 | $54,922 | $8,750 | $46,172 |
| 2016 | $3,893 | $60,417 | $8,050 | $52,367 |
| 2015 | $3,876 | $60,417 | $8,050 | $52,367 |
| 2014 | $3,887 | $60,417 | $8,050 | $52,367 |
| 2013 | $3,836 | $65,671 | $8,750 | $56,921 |
Source: Public Records
Map
Nearby Homes
- 4187 Intrepid Dr Unit 38
- 4086 Resolute Cir Unit 481
- 4002 Resolute Cir
- 3918 Enterprise Cir Unit 532
- 3834 Enterprise Cir
- 9905 Regatta Dr
- 4230 Endeavor Dr Unit 101
- 4771 Dry Ridge Rd
- 10263 Colerain Ave
- 4221 Endeavor Dr
- 9800 Regatta Dr
- 9801 Regatta Dr
- 9873 Kittywood Dr
- 9952 Capstan Dr
- 3724 Yellowstone Dr
- 10280 Dewhill Ln
- 9601 Pebble View Dr
- 9862 Dunlap Dr
- 3420 Grovewood Dr
- 9821 Mel Carl Dr
- 4280 Intrepid Dr Unit 1
- 4270 Intrepid Dr
- 4276 Intrepid Dr
- 4272 Intrepid Dr
- 4139 Intrepid Dr
- 4278 Intrepid Dr Unit 2
- 4258 Intrepid Dr
- 4274 Intrepid Dr
- 4275 Intrepid Dr
- 4281 Intrepid Dr Unit 54
- 4277 Intrepid Dr
- 4279 Intrepid Dr
- 4265 Intrepid Dr Unit 48
- 4263 Intrepid Dr
- 4269 Intrepid Dr
- 4267 Intrepid Dr
- 4256 Intrepid Dr
- 4250 Intrepid Dr
- 4252 Intrepid Dr
- 4260 Intrepid Dr
Your Personal Tour Guide
Ask me questions while you tour the home.