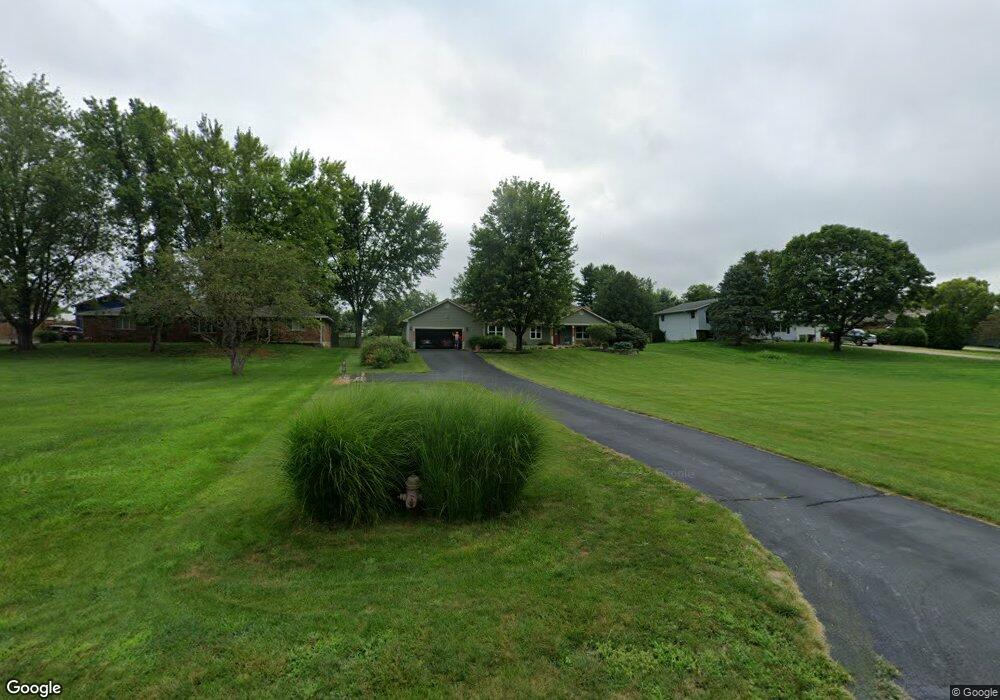
4270 Manchester Rd Franklin, OH 45005
Estimated Value: $356,000 - $392,000
3
Beds
2
Baths
2,130
Sq Ft
$176/Sq Ft
Est. Value
About This Home
This home is located at 4270 Manchester Rd, Franklin, OH 45005 and is currently estimated at $375,574, approximately $176 per square foot. 4270 Manchester Rd is a home located in Warren County with nearby schools including Franklin High School and St. John XXIII Catholic School.
Ownership History
Date
Name
Owned For
Owner Type
Purchase Details
Closed on
Jul 12, 2004
Sold by
Mckanna Don E and Mckanna Audrey R
Bought by
Hagestrom Csokasy David L and Hagestrom Csokasy Judith A
Current Estimated Value
Home Financials for this Owner
Home Financials are based on the most recent Mortgage that was taken out on this home.
Original Mortgage
$35,000
Interest Rate
6.37%
Mortgage Type
Purchase Money Mortgage
Purchase Details
Closed on
May 13, 1994
Sold by
Muller Muller and Muller Ernest S
Bought by
Webb Webb and Webb Douglas E
Purchase Details
Closed on
Oct 24, 1991
Sold by
Webb Douglas E and Webb Douglas E
Bought by
Muller and Muller Ernest S
Purchase Details
Closed on
Dec 17, 1990
Sold by
Whitten Kirby and Whitten G.
Bought by
Webb Webb and Webb Douglas E
Purchase Details
Closed on
Feb 2, 1987
Sold by
Allen Arthur Raymond and Arthur Raymond
Bought by
Kirby and Kirby Whitten G
Purchase Details
Closed on
Mar 12, 1984
Sold by
Wells Marple and Wells Ruby
Bought by
Allen and Arthur Raymond
Create a Home Valuation Report for This Property
The Home Valuation Report is an in-depth analysis detailing your home's value as well as a comparison with similar homes in the area
Home Values in the Area
Average Home Value in this Area
Purchase History
| Date | Buyer | Sale Price | Title Company |
|---|---|---|---|
| Hagestrom Csokasy David L | $190,000 | Lawyers Title Fairfield | |
| Webb Webb | -- | -- | |
| Muller | $4,600 | -- | |
| Webb Webb | $5,000 | -- | |
| Kirby | $9,000 | -- | |
| Allen | $11,500 | -- |
Source: Public Records
Mortgage History
| Date | Status | Borrower | Loan Amount |
|---|---|---|---|
| Closed | Hagestrom Csokasy David L | $35,000 |
Source: Public Records
Tax History Compared to Growth
Tax History
| Year | Tax Paid | Tax Assessment Tax Assessment Total Assessment is a certain percentage of the fair market value that is determined by local assessors to be the total taxable value of land and additions on the property. | Land | Improvement |
|---|---|---|---|---|
| 2024 | $4,308 | $107,720 | $21,520 | $86,200 |
| 2023 | $3,895 | $88,476 | $12,033 | $76,443 |
| 2022 | $3,810 | $88,477 | $12,033 | $76,444 |
| 2021 | $3,597 | $88,477 | $12,033 | $76,444 |
| 2020 | $3,241 | $71,932 | $9,783 | $62,150 |
| 2019 | $2,926 | $71,932 | $9,783 | $62,150 |
| 2018 | $2,921 | $71,932 | $9,783 | $62,150 |
| 2017 | $2,859 | $64,859 | $8,974 | $55,885 |
| 2016 | $2,921 | $64,859 | $8,974 | $55,885 |
| 2015 | $2,921 | $64,859 | $8,974 | $55,885 |
| 2014 | $2,655 | $58,430 | $8,090 | $50,350 |
| 2013 | $2,255 | $70,700 | $9,780 | $60,920 |
Source: Public Records
Map
Nearby Homes
- 5059 Robinson Vail Rd
- 4640 Shaker Rd
- 191 Lakeview Dr
- 3338 Mclean Rd
- 6 Beal Rd
- 3749 Wilson Farms Blvd
- 4480 N St Rt 123
- 3136 W Pekin Rd
- 206 Meadow Dr
- 200 Meadow Dr
- 5756 Union Rd
- 4689 Fisher Rd
- 3441 Madison Grace Way
- 25 Timber Creek Dr
- 3457 Madison Grace Way
- 4271 Ohio 123
- 5845 Manchester Rd
- 3644 Connie Dr
- 3621 Garrett Dr
- 22 Green Meadow Ct
- 4248 Manchester Rd
- 4282 Manchester Rd
- 4238 Manchester Rd
- 4300 Manchester Rd
- 4344 Manchester Rd
- 4200 Manchester Rd
- 4348 Manchester Rd
- 4334 Manchester Rd
- 4293 Manchester Rd
- 4315 Manchester Rd
- 4329 Manchester Rd
- 4343 Manchester Rd
- 4368 Manchester Rd
- 4359 Manchester Rd
- 4371 Manchester Rd
- 4160 Manchester Rd
- 4120 Manchester Rd
- 4123 Manchester Rd
- 0 Manchester Rd
- 4104 Manchester Rd