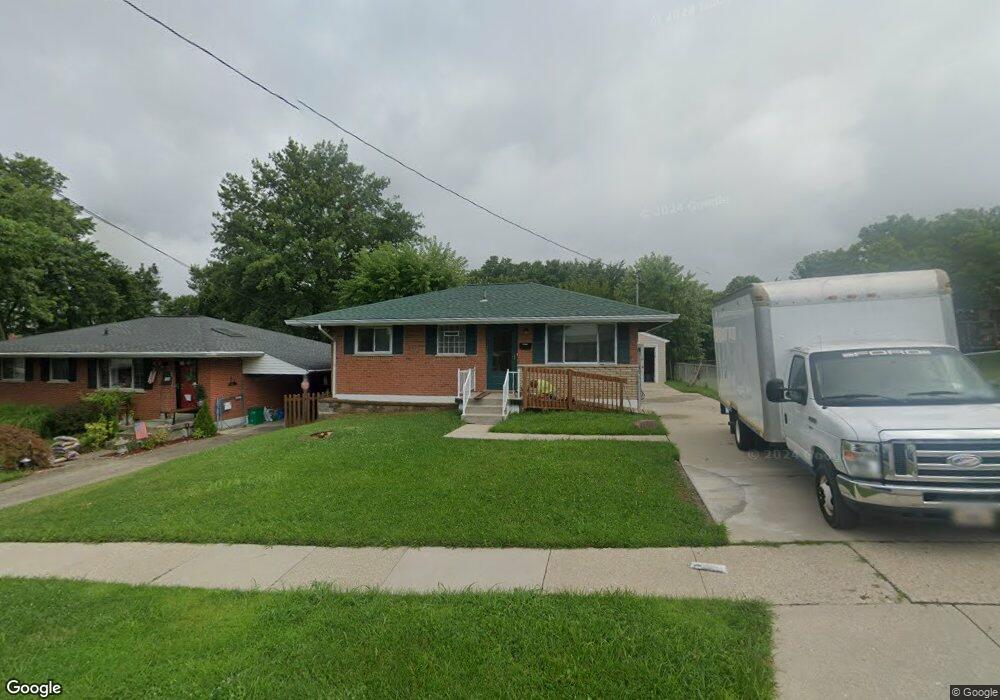
4270 Selby Ct Cincinnati, OH 45211
Estimated Value: $154,000 - $214,000
1
Bed
2
Baths
1,245
Sq Ft
$140/Sq Ft
Est. Value
About This Home
This home is located at 4270 Selby Ct, Cincinnati, OH 45211 and is currently estimated at $174,444, approximately $140 per square foot. 4270 Selby Ct is a home located in Hamilton County with nearby schools including Cheviot Elementary School, Western Hills High School, and Gilbert A. Dater High School.
Ownership History
Date
Name
Owned For
Owner Type
Purchase Details
Closed on
Sep 26, 2022
Sold by
Muddiman Joseph L
Bought by
Muddiman Karen L
Current Estimated Value
Home Financials for this Owner
Home Financials are based on the most recent Mortgage that was taken out on this home.
Original Mortgage
$100,000
Outstanding Balance
$95,034
Interest Rate
5.13%
Mortgage Type
New Conventional
Estimated Equity
$79,410
Purchase Details
Closed on
Dec 30, 2021
Sold by
Troyer Robert C
Bought by
Muddirnan Joseph L
Purchase Details
Closed on
Aug 29, 2003
Sold by
Gallagher Daniel J
Bought by
Troyer Robert C
Home Financials for this Owner
Home Financials are based on the most recent Mortgage that was taken out on this home.
Original Mortgage
$92,800
Interest Rate
6.18%
Mortgage Type
Unknown
Purchase Details
Closed on
Jan 26, 1998
Sold by
Miller Erwin C and Miller Renate K
Bought by
Gallagher Daniel J
Home Financials for this Owner
Home Financials are based on the most recent Mortgage that was taken out on this home.
Original Mortgage
$80,067
Interest Rate
7.16%
Create a Home Valuation Report for This Property
The Home Valuation Report is an in-depth analysis detailing your home's value as well as a comparison with similar homes in the area
Home Values in the Area
Average Home Value in this Area
Purchase History
We collect this data history from publicly available records. To have your information removed, we recommend requesting removal directly through your county’s website.
| Date | Buyer | Sale Price | Title Company |
|---|---|---|---|
| Muddiman Karen L | $125,000 | -- | |
| Muddiman Karen L | $125,000 | None Listed On Document | |
| Muddirnan Joseph L | $100,000 | Reuter James E | |
| Troyer Robert C | $116,000 | Old National Title Llc | |
| Gallagher Daniel J | $88,000 | L & D Title Agency Inc |
Source: Public Records
Mortgage History
We collect this data history from publicly available records. To have your information removed, we recommend requesting removal directly through your county’s website.
| Date | Status | Borrower | Loan Amount |
|---|---|---|---|
| Open | Muddiman Karen L | $100,000 | |
| Closed | Muddiman Karen L | $100,000 | |
| Previous Owner | Troyer Robert C | $92,800 | |
| Previous Owner | Gallagher Daniel J | $80,067 |
Source: Public Records
Tax History
| Year | Tax Paid | Tax Assessment Tax Assessment Total Assessment is a certain percentage of the fair market value that is determined by local assessors to be the total taxable value of land and additions on the property. | Land | Improvement |
|---|---|---|---|---|
| 2025 | $2,185 | $35,000 | $7,805 | $27,195 |
| 2024 | $2,126 | $35,000 | $7,805 | $27,195 |
| 2023 | $2,168 | $35,000 | $7,805 | $27,195 |
| 2022 | $2,528 | $35,354 | $7,382 | $27,972 |
| 2021 | $2,467 | $35,354 | $7,382 | $27,972 |
| 2020 | $2,501 | $35,354 | $7,382 | $27,972 |
| 2019 | $2,463 | $31,287 | $6,531 | $24,756 |
| 2018 | $2,466 | $31,287 | $6,531 | $24,756 |
| 2017 | $2,359 | $31,287 | $6,531 | $24,756 |
| 2016 | $2,422 | $31,525 | $6,811 | $24,714 |
| 2015 | $2,199 | $31,525 | $6,811 | $24,714 |
| 2014 | $2,149 | $31,525 | $6,811 | $24,714 |
| 2013 | $2,295 | $33,184 | $7,168 | $26,016 |
Source: Public Records
Map
Nearby Homes
- 4229 Harding Ave
- 4202 Harding Ave
- 5465 Childs Ave
- 5450 Lawrence Rd
- 4461 Grove Ave
- 4436 Grove Ave
- 3578 Fieldcrest Dr
- 3771 Herbert Ave
- 3332 Greenway Ave
- 5542 Lawrence Rd
- 3314 Lakeview Ave
- 5572 Childs Ave
- 3317 Buell St
- 5579 Childs Ave
- 5368 Werk Rd
- 3736 Herbert Ave
- 3853 Weirman Ave
- 3368 Glenmont Ln
- 5590 Surrey Ave
- 5646 Lawrence Rd
Your Personal Tour Guide
Ask me questions while you tour the home.