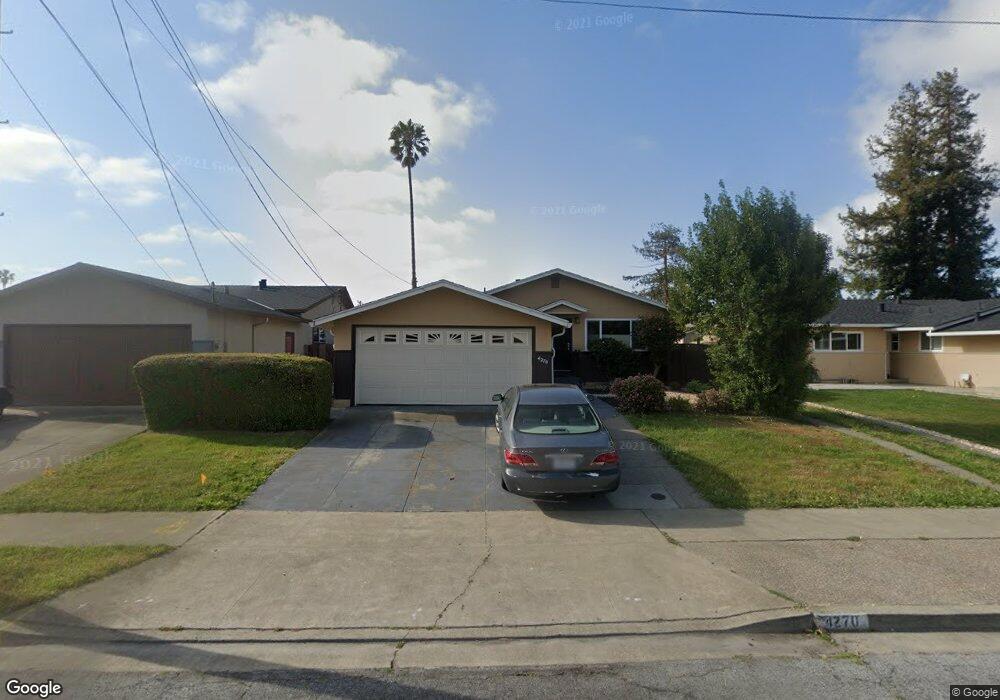
4270 Woodcrest Dr Fremont, CA 94538
Grimmer NeighborhoodEstimated Value: $1,468,736 - $1,759,000
3
Beds
2
Baths
1,276
Sq Ft
$1,239/Sq Ft
Est. Value
About This Home
This home is located at 4270 Woodcrest Dr, Fremont, CA 94538 and is currently estimated at $1,580,934, approximately $1,238 per square foot. 4270 Woodcrest Dr is a home located in Alameda County with nearby schools including Harvey Green Elementary School, John M. Horner Junior High School, and Irvington High School.
Ownership History
Date
Name
Owned For
Owner Type
Purchase Details
Closed on
Jul 10, 2011
Sold by
Huang Beenchu and Pan Kueimei
Bought by
Huang Beenchu and Pan Kueimei
Current Estimated Value
Purchase Details
Closed on
Aug 10, 2009
Sold by
Rawson Ralph E and Rawson Marjorie M
Bought by
Huang Beenchu and Pan Kueimei
Purchase Details
Closed on
Aug 25, 1999
Sold by
Rawson Ralph E and Rawson Marjorie M
Bought by
Rawson Ralph and Rawson Marjorie
Home Financials for this Owner
Home Financials are based on the most recent Mortgage that was taken out on this home.
Original Mortgage
$17,113
Interest Rate
7.47%
Purchase Details
Closed on
Aug 25, 1998
Sold by
Rawson Ralph E and Rawson Marjorie M
Bought by
Rawson Ralph E and Rawson Marjorie M
Purchase Details
Closed on
Mar 5, 1996
Sold by
Rawson Ralph E and Rawson Marjorie
Bought by
Rawson Ralph E and Rawson Marjorie M
Create a Home Valuation Report for This Property
The Home Valuation Report is an in-depth analysis detailing your home's value as well as a comparison with similar homes in the area
Home Values in the Area
Average Home Value in this Area
Purchase History
| Date | Buyer | Sale Price | Title Company |
|---|---|---|---|
| Huang Beenchu | -- | None Available | |
| Huang Beenchu | $441,000 | Old Republic Title Company | |
| Rawson Ralph | -- | Fidelity National Title Co | |
| Rawson Ralph E | -- | Fidelity Title | |
| Rawson Ralph E | -- | -- |
Source: Public Records
Mortgage History
| Date | Status | Borrower | Loan Amount |
|---|---|---|---|
| Previous Owner | Rawson Ralph | $17,113 |
Source: Public Records
Tax History Compared to Growth
Tax History
| Year | Tax Paid | Tax Assessment Tax Assessment Total Assessment is a certain percentage of the fair market value that is determined by local assessors to be the total taxable value of land and additions on the property. | Land | Improvement |
|---|---|---|---|---|
| 2025 | $7,148 | $569,211 | $170,763 | $398,448 |
| 2024 | $7,148 | $558,054 | $167,416 | $390,638 |
| 2023 | $6,950 | $547,113 | $164,134 | $382,979 |
| 2022 | $6,851 | $536,387 | $160,916 | $375,471 |
| 2021 | $6,686 | $525,874 | $157,762 | $368,112 |
| 2020 | $6,671 | $520,485 | $156,145 | $364,340 |
| 2019 | $6,598 | $510,280 | $153,084 | $357,196 |
| 2018 | $6,469 | $500,278 | $150,083 | $350,195 |
| 2017 | $6,308 | $490,470 | $147,141 | $343,329 |
| 2016 | $6,197 | $480,857 | $144,257 | $336,600 |
| 2015 | $6,110 | $473,637 | $142,091 | $331,546 |
| 2014 | $6,002 | $464,363 | $139,309 | $325,054 |
Source: Public Records
Map
Nearby Homes
- 4309 Bora Ave
- 42747 Wixon Dr
- 42932 Peachwood St
- 4533 Capewood Terrace
- 3923 Wildflower Common Unit 19
- 4537 Capewood Terrace
- 3872 Wildflower Common Unit 27
- 42759 Newport Dr
- 3918 Fossano Common
- 4860 Bryce Canyon Park Dr
- 3800 Adams Ave
- 40696 Robin St
- 43163 Grimmer Terrace
- 41212 Fremont Blvd
- 4751 Wadsworth Ct
- 262 Manitoba Green
- 261 Manitoba Green Unit 261
- 257 Manitoba Green
- 4463 Hyde Common Unit 306
- 208 Manitoba Terrace
- 4282 Woodcrest Dr
- 4258 Woodcrest Dr
- 4246 Woodcrest Dr
- 4294 Woodcrest Dr
- 4297 Bora Bora Ave
- 4283 Bora Ave
- 4283 Bora Bora Ave
- 4309 Bora Bora Ave
- 42245 Woodcrest Ct
- 4265 Bora Bora Ave
- 4321 Bora Ave
- 4321 Bora Bora Ave
- 4234 Woodcrest Dr
- 4312 Woodcrest Dr
- 42246 Edgewood St
- 4247 Bora Bora Ave
- 4333 Bora Ave
- 4333 Bora Bora Ave
- 4222 Woodcrest Dr
- 4324 Woodcrest Dr