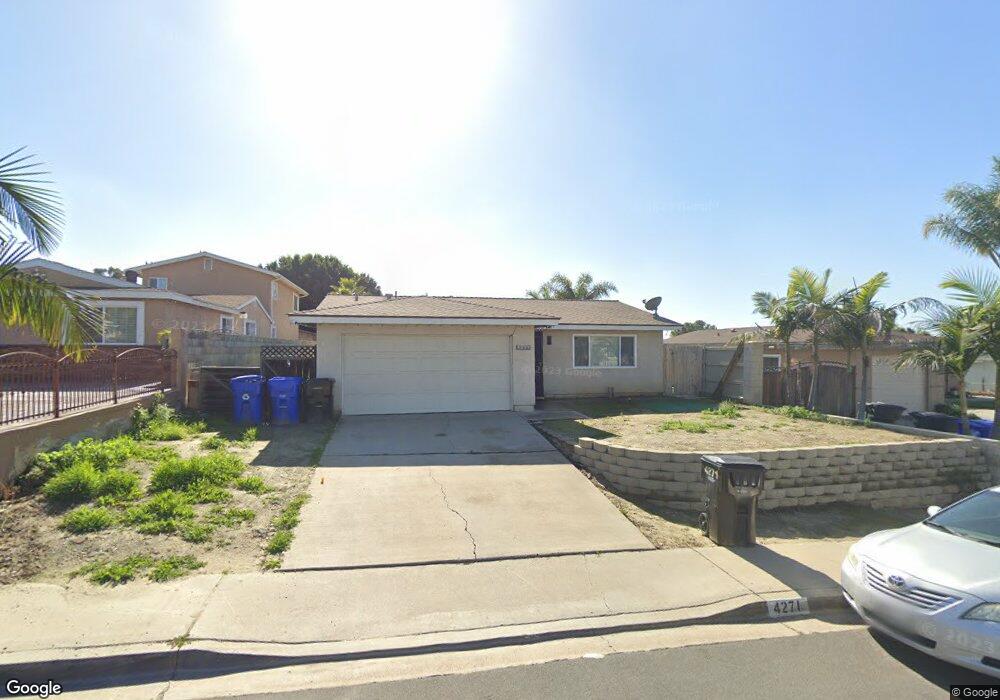
4271 Layla Ct San Diego, CA 92154
Otay Mesa West NeighborhoodEstimated Value: $747,073 - $897,000
4
Beds
2
Baths
1,503
Sq Ft
$536/Sq Ft
Est. Value
About This Home
This home is located at 4271 Layla Ct, San Diego, CA 92154 and is currently estimated at $806,018, approximately $536 per square foot. 4271 Layla Ct is a home located in San Diego County with nearby schools including Los Altos Elementary School, Montgomery Middle School, and Montgomery Senior High School.
Ownership History
Date
Name
Owned For
Owner Type
Purchase Details
Closed on
Oct 22, 2018
Sold by
Hawtree Ronald J and Hawtree Mindy K
Bought by
Valdez Julio Cesar and Valdez Karina
Current Estimated Value
Home Financials for this Owner
Home Financials are based on the most recent Mortgage that was taken out on this home.
Original Mortgage
$441,849
Outstanding Balance
$387,353
Interest Rate
4.75%
Mortgage Type
FHA
Estimated Equity
$418,665
Purchase Details
Closed on
Jan 3, 2017
Sold by
Hawtree Ronald J and Hawtree Mindy K
Bought by
Hawtree Ronald J and Hawtree Mindy K
Home Financials for this Owner
Home Financials are based on the most recent Mortgage that was taken out on this home.
Original Mortgage
$240,000
Interest Rate
2.87%
Mortgage Type
Adjustable Rate Mortgage/ARM
Purchase Details
Closed on
May 19, 2009
Sold by
Hawtree Ronald J and Hawtree Mindy K
Bought by
Hawtree Ronald J and Hawtree Mindy K
Purchase Details
Closed on
May 15, 1985
Bought by
Hawtree Ronald J Mindy K
Create a Home Valuation Report for This Property
The Home Valuation Report is an in-depth analysis detailing your home's value as well as a comparison with similar homes in the area
Home Values in the Area
Average Home Value in this Area
Purchase History
| Date | Buyer | Sale Price | Title Company |
|---|---|---|---|
| Valdez Julio Cesar | $450,000 | Corinthian Title Company | |
| Hawtree Ronald J | -- | California Members Title Ins | |
| Hawtree Ronald J | -- | California Members Title Ins | |
| Hawtree Ronald J | -- | None Available | |
| Hawtree Ronald J Mindy K | $83,000 | -- |
Source: Public Records
Mortgage History
| Date | Status | Borrower | Loan Amount |
|---|---|---|---|
| Open | Valdez Julio Cesar | $441,849 | |
| Previous Owner | Hawtree Ronald J | $240,000 |
Source: Public Records
Tax History Compared to Growth
Tax History
| Year | Tax Paid | Tax Assessment Tax Assessment Total Assessment is a certain percentage of the fair market value that is determined by local assessors to be the total taxable value of land and additions on the property. | Land | Improvement |
|---|---|---|---|---|
| 2025 | $5,812 | $501,978 | $113,782 | $388,196 |
| 2024 | $5,812 | $492,136 | $111,551 | $380,585 |
| 2023 | $5,733 | $482,487 | $109,364 | $373,123 |
| 2022 | $5,568 | $473,027 | $107,220 | $365,807 |
| 2021 | $5,440 | $463,753 | $105,118 | $358,635 |
| 2020 | $5,310 | $458,999 | $104,041 | $354,958 |
| 2019 | $5,173 | $450,000 | $102,001 | $347,999 |
| 2018 | $1,652 | $148,133 | $33,577 | $114,556 |
| 2017 | $1,615 | $145,229 | $32,919 | $112,310 |
| 2016 | $1,575 | $142,382 | $32,274 | $110,108 |
| 2015 | $1,552 | $140,245 | $31,790 | $108,455 |
| 2014 | $1,526 | $137,499 | $31,168 | $106,331 |
Source: Public Records
Map
Nearby Homes
- 4151 Alcorn St
- 1185 Ransom St
- 4558 Northern Moon Way
- 1378 Starry Way
- 150 Diza Rd
- 3844 Via Del Bardo
- 3971 Caseman Ave
- 3903 Via Del Bardo
- 3801 Via de la Bandola
- 3833 Via Del Bardo
- 1568 Coporate Center Drive & Otay Mesa Rd Unit 12,13,14
- 823 Fuchsia Ln
- 1564 Smythe Ave
- 4205 Rene Dr
- 3754 Shooting Star Dr
- 4821 Sea Water Ln
- 4026 Coleman Ave
- 4250 Lemonseed Dr
- 1697 Shooting Star Ct
- 3982 Palm Ave