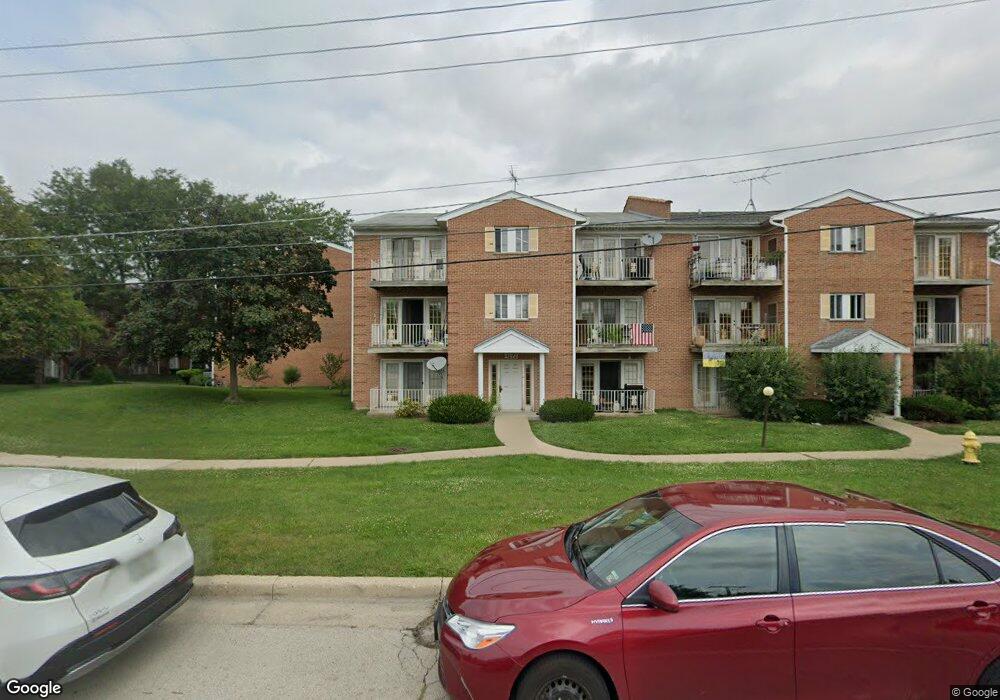
4272 Central Rd Unit 4272 Glenview, IL 60025
Estimated Value: $850,000 - $1,491,557
2
Beds
--
Bath
718
Sq Ft
$1,463/Sq Ft
Est. Value
About This Home
This home is located at 4272 Central Rd Unit 4272, Glenview, IL 60025 and is currently estimated at $1,050,389, approximately $1,462 per square foot. 4272 Central Rd Unit 4272 is a home located in Cook County with nearby schools including Henking Elementary School, Hoffman Elementary School, and Springman Middle School.
Ownership History
Date
Name
Owned For
Owner Type
Purchase Details
Closed on
Jun 20, 2018
Sold by
Pais Fried Morry and Pais Fried Myrna
Bought by
Fried Morry and Fried Myrna
Current Estimated Value
Purchase Details
Closed on
May 21, 2018
Sold by
Fried Ted A
Bought by
Fried Ted A and Ted A Fried Trust
Purchase Details
Closed on
Mar 28, 2008
Sold by
Parkway Bank & Trust Co
Bought by
Fried Morrey and Fried Ted
Purchase Details
Closed on
Feb 4, 1996
Sold by
Mikucki Frank and Mikucki Laura J
Bought by
Parkway Bank & Trust Company
Purchase Details
Closed on
Mar 31, 1994
Sold by
American National Bk & Tr Co Of Chicago
Bought by
Mikucki Frank and Mikucki Laura J
Home Financials for this Owner
Home Financials are based on the most recent Mortgage that was taken out on this home.
Original Mortgage
$292,500
Interest Rate
7.35%
Create a Home Valuation Report for This Property
The Home Valuation Report is an in-depth analysis detailing your home's value as well as a comparison with similar homes in the area
Home Values in the Area
Average Home Value in this Area
Purchase History
| Date | Buyer | Sale Price | Title Company |
|---|---|---|---|
| Fried Morry | -- | Attorney | |
| Fried Ted A | -- | Chicago Title | |
| Fried Morrey | $700,000 | Cti | |
| Parkway Bank & Trust Company | -- | -- | |
| Mikucki Frank | $260,000 | -- |
Source: Public Records
Mortgage History
| Date | Status | Borrower | Loan Amount |
|---|---|---|---|
| Previous Owner | Mikucki Frank | $292,500 |
Source: Public Records
Tax History Compared to Growth
Tax History
| Year | Tax Paid | Tax Assessment Tax Assessment Total Assessment is a certain percentage of the fair market value that is determined by local assessors to be the total taxable value of land and additions on the property. | Land | Improvement |
|---|---|---|---|---|
| 2024 | $14,885 | $70,010 | $9,493 | $60,517 |
| 2023 | $14,209 | $70,010 | $9,493 | $60,517 |
| 2022 | $14,209 | $70,010 | $9,493 | $60,517 |
| 2021 | $13,199 | $55,919 | $6,472 | $49,447 |
| 2020 | $13,164 | $55,919 | $6,472 | $49,447 |
| 2019 | $12,282 | $61,976 | $6,472 | $55,504 |
| 2018 | $11,003 | $49,921 | $5,609 | $44,312 |
| 2017 | $10,699 | $49,921 | $5,609 | $44,312 |
| 2016 | $10,085 | $49,921 | $5,609 | $44,312 |
| 2015 | $11,530 | $50,822 | $4,530 | $46,292 |
| 2014 | $11,260 | $50,822 | $4,530 | $46,292 |
| 2013 | $10,947 | $50,822 | $4,530 | $46,292 |
Source: Public Records
Map
Nearby Homes
- 625 Quincy Bridge Ln Unit 301
- 10151 Meadow Ln
- 9517 W Central Rd
- 10373 Dearlove Rd Unit 4E
- 4150 Central Rd Unit 3E
- 10009 Meadow Ln
- 701 Forum Square Unit 609
- 4170 Cove Ln Unit 2B
- 600 Naples Ct Unit 107
- 600 Naples Ct Unit 608
- 9411 Harrison St Unit 471494
- 4146 Cove Ln Unit D
- 3700 Capri Ct Unit 206
- 4128 Cove Ln Unit C
- 10430 Michael Todd Terrace
- 3732 Capri Ct Unit T18A
- 491 Leslie Ct Unit 201
- 9330 Hamilton Ct Unit E
- 9821 Bianco Terrace Unit A
- 9600 S Lyman Ave
- 4272 Central Rd Unit 301
- 4272 Central Rd Unit 302
- 4272 Central Rd Unit 202
- 4272 Central Rd Unit 201
- 4272 Central Rd Unit 101
- 4272 Central Rd Unit 102
- 4272 Central Rd
- 4272 W Central Rd
- 4270 Central Rd Unit 4270
- 4270 Central Rd
- 4276 Central Rd Unit 4276
- 4276 Central Rd Unit 102
- 4276 Central Rd Unit 101
- 4278 Central Rd Unit 4278
- 4268 Central Rd Unit 4268
- 4266 Central Rd Unit 4266
- 4266 Central Rd Unit 301
- 4266 Central Rd
- 4266 Central Rd
- 4250 Central Rd Unit 4250