Estimated Value: $114,000 - $244,000
2
Beds
1
Bath
1,080
Sq Ft
$149/Sq Ft
Est. Value
About This Home
This home is located at 4272 Curve Nankipoo Rd, Halls, TN 38040 and is currently estimated at $160,874, approximately $148 per square foot. 4272 Curve Nankipoo Rd is a home located in Lauderdale County with nearby schools including Halls Elementary School, Halls Junior High School, and Halls High School.
Ownership History
Date
Name
Owned For
Owner Type
Purchase Details
Closed on
Mar 29, 2017
Sold by
Tolbert James R
Bought by
Tolbert James Ralph and Tolbert Phyllis Yvonne
Current Estimated Value
Purchase Details
Closed on
Sep 23, 2009
Sold by
Sec Of Housing
Bought by
Tolbert Glenda M
Purchase Details
Closed on
Feb 26, 2009
Sold by
Michaels Ricky D
Bought by
Sec Of Housing
Purchase Details
Closed on
Oct 11, 2006
Sold by
Closing Primacy
Bought by
Michaels Ricky D
Home Financials for this Owner
Home Financials are based on the most recent Mortgage that was taken out on this home.
Original Mortgage
$65,978
Interest Rate
6.39%
Mortgage Type
FHA
Purchase Details
Closed on
Jul 16, 1999
Sold by
Apperson James F
Bought by
Lester Silence and Lester Barbara
Purchase Details
Closed on
Apr 23, 1985
Bought by
Apperson James F and Apperson Helen
Purchase Details
Closed on
Aug 21, 1978
Create a Home Valuation Report for This Property
The Home Valuation Report is an in-depth analysis detailing your home's value as well as a comparison with similar homes in the area
Home Values in the Area
Average Home Value in this Area
Purchase History
| Date | Buyer | Sale Price | Title Company |
|---|---|---|---|
| Tolbert James Ralph | -- | -- | |
| Tolbert Glenda M | $33,011 | -- | |
| Sec Of Housing | $70,150 | -- | |
| Michaels Ricky D | $66,500 | -- | |
| Closing Primacy | $66,500 | -- | |
| Lester Silence | $59,900 | -- | |
| Apperson James F | -- | -- | |
| -- | -- | -- |
Source: Public Records
Mortgage History
| Date | Status | Borrower | Loan Amount |
|---|---|---|---|
| Previous Owner | Not Available | $65,978 |
Source: Public Records
Tax History Compared to Growth
Tax History
| Year | Tax Paid | Tax Assessment Tax Assessment Total Assessment is a certain percentage of the fair market value that is determined by local assessors to be the total taxable value of land and additions on the property. | Land | Improvement |
|---|---|---|---|---|
| 2024 | $486 | $19,150 | $3,250 | $15,900 |
| 2023 | $390 | $19,150 | $3,250 | $15,900 |
| 2022 | $390 | $15,350 | $3,250 | $12,100 |
| 2021 | $390 | $15,350 | $3,250 | $12,100 |
| 2020 | $384 | $15,350 | $3,250 | $12,100 |
| 2019 | $384 | $13,000 | $2,600 | $10,400 |
| 2018 | $358 | $13,000 | $2,600 | $10,400 |
| 2017 | $361 | $12,125 | $2,600 | $9,525 |
| 2016 | $361 | $12,125 | $2,600 | $9,525 |
| 2015 | $388 | $12,125 | $2,600 | $9,525 |
| 2014 | $388 | $13,375 | $2,775 | $10,600 |
Source: Public Records
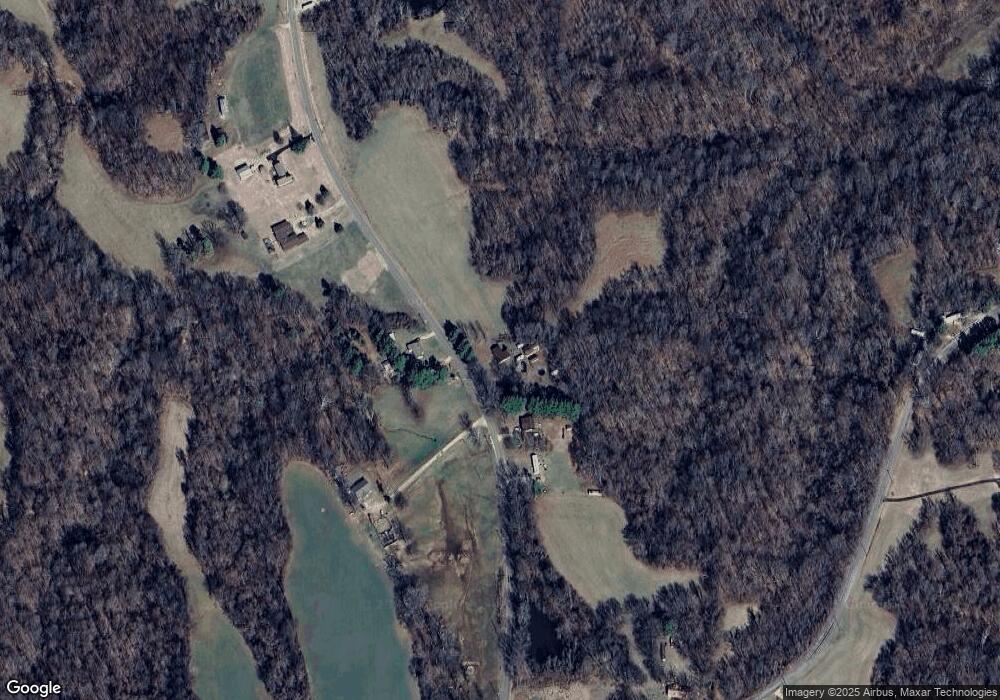
Map
Nearby Homes
- 000 Dry Hill Rd E
- 0 Dry Hill Rd E
- 328 Cates Rd
- 00 Hwy 51 Hwy
- 656 Cook Rd
- 710 Porter's Gap Rd
- 569 Porters Gap Rd
- 0 Edith Nankipoo Rd Unit 10200861
- 302 Ford Store Rd
- 421 Curve Woodville Rd
- 10756 U S 51
- 426 Curve Woodville Rd
- 333 Wardlow St W
- 35 Ellis Loop
- 127 Harvey Newman Rd
- 71 4th St
- 622 Bluebird Hill Rd
- 000 Bluebird Hill Rd
- 5605 W 88 Hwy
- 157 E Wardlow St
- 4230 Curve Nankipoo Rd
- 4245 Curve Nankipoo Rd
- 4230 Curve Nankipoo Rd
- 4209 Curve Nankipoo Rd
- 4421 Curve Nankipoo Rd
- 4389 Curve Nankipoo Rd
- 113 Steelman Rd
- 4530 Curve Nankipoo Rd
- 403 Steelman Rd
- 3761 Curve Nankipoo Rd
- 4209 Curve Nankipoo 2 Rd
- 4590 Curve Nankipoo Rd
- 330 Steelman Rd
- 144 Steelman Rd
- 172 Steelman Rd
- 3916 Curve Nankipoo Rd
- 529 Steelman Rd
- 4760 Curve Nankipoo Rd
- 4770 Curve Nankipoo Rd
- 125 Horseshoe Cir