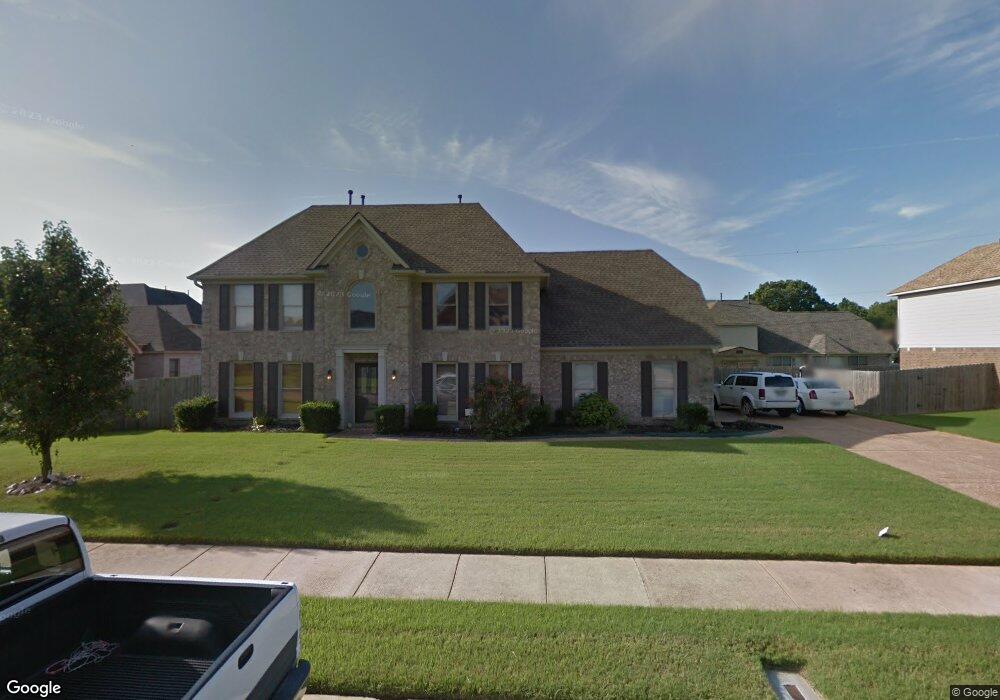
4273 Tywalp Cove Millington, TN 38053
Estimated Value: $303,000 - $397,000
4
Beds
3
Baths
3,029
Sq Ft
$114/Sq Ft
Est. Value
About This Home
This home is located at 4273 Tywalp Cove, Millington, TN 38053 and is currently estimated at $346,597, approximately $114 per square foot. 4273 Tywalp Cove is a home located in Shelby County with nearby schools including Millington Elementary School, Millington High School, and Woodlawn Baptist Academy.
Ownership History
Date
Name
Owned For
Owner Type
Purchase Details
Closed on
Apr 15, 2019
Sold by
Herron Patricia Ann
Bought by
Herron Patricia A and Patricia A Herron Revocable Living Trust
Current Estimated Value
Purchase Details
Closed on
Nov 9, 2016
Sold by
York Lee and York Chauncey Lee
Bought by
Herron Patricia Ann
Purchase Details
Closed on
Feb 1, 2005
Sold by
Califf Cary R
Bought by
Chamberlain & Mccreery Inc
Create a Home Valuation Report for This Property
The Home Valuation Report is an in-depth analysis detailing your home's value as well as a comparison with similar homes in the area
Home Values in the Area
Average Home Value in this Area
Purchase History
| Date | Buyer | Sale Price | Title Company |
|---|---|---|---|
| Herron Patricia A | -- | None Available | |
| Herron Patricia Ann | -- | None Available | |
| Chamberlain & Mccreery Inc | $89,700 | -- |
Source: Public Records
Mortgage History
| Date | Status | Borrower | Loan Amount |
|---|---|---|---|
| Closed | Chamberlain & Mccreery Inc | $0 |
Source: Public Records
Tax History Compared to Growth
Tax History
| Year | Tax Paid | Tax Assessment Tax Assessment Total Assessment is a certain percentage of the fair market value that is determined by local assessors to be the total taxable value of land and additions on the property. | Land | Improvement |
|---|---|---|---|---|
| 2025 | $3,013 | $86,975 | $8,500 | $78,475 |
| 2024 | $3,013 | $62,900 | $7,650 | $55,250 |
| 2023 | $3,013 | $62,900 | $7,650 | $55,250 |
| 2022 | $3,013 | $62,900 | $7,650 | $55,250 |
| 2021 | $3,051 | $62,900 | $7,650 | $55,250 |
| 2020 | $2,572 | $46,100 | $7,650 | $38,450 |
| 2019 | $1,867 | $46,100 | $7,650 | $38,450 |
| 2018 | $2,572 | $46,100 | $7,650 | $38,450 |
| 2017 | $2,600 | $46,100 | $7,650 | $38,450 |
| 2016 | $2,556 | $43,325 | $0 | $0 |
| 2014 | $1,893 | $43,325 | $0 | $0 |
Source: Public Records
Map
Nearby Homes
- 4235 Sykes Rd
- 4140 Pleasant Ridge Rd
- 6866 Basun Cir E
- 4469 Queen Sinclair Cir
- 4578 Basun Cir E
- 4537 Kings Station Rd
- 4600 Goldsby Place
- 4527 Basun Cir S
- 4531 Basun Cir S
- 4537 Basun Cir S
- 4578 Basun Cir N
- 3945 Crenshaw Rd
- 3545 Lucy Rd
- 5975 Prairie Cove
- 4703 Cedar Rose Dr
- 4551 Waverly Farms Rd
- 4288 Peach Run Lane Ln
- 7266 Raleigh Millington Rd
- 4302 Peach Run Lane Ln
- 4274 Peach Run Lane Ln
- 4269 Tywalp Cove
- 4270 Colorday Cove
- 6529 Emmitt St
- 4260 Colorday Cove
- 6525 Emmitt St
- 4272 Tywalp Cove
- 6545 Emmitt St
- 4259 Tywalp Cove
- 4268 Tywalp Cove
- 4254 Colorday Cove
- 4275 Nichols Cove
- 4265 Colorday Cove
- 4260 Tywalp Cove
- 4256 Tywalp Cove
- 6528 Emmitt St
- 4285 Nichols Cove
- 4257 Colorday Cove
- 4244 Colorday Cove
- 6534 Emmitt St
- 4292 Zachary St