4273 Vine St Bridgman, MI 49106
Estimated Value: $164,000 - $212,000
2
Beds
1
Bath
742
Sq Ft
$254/Sq Ft
Est. Value
About This Home
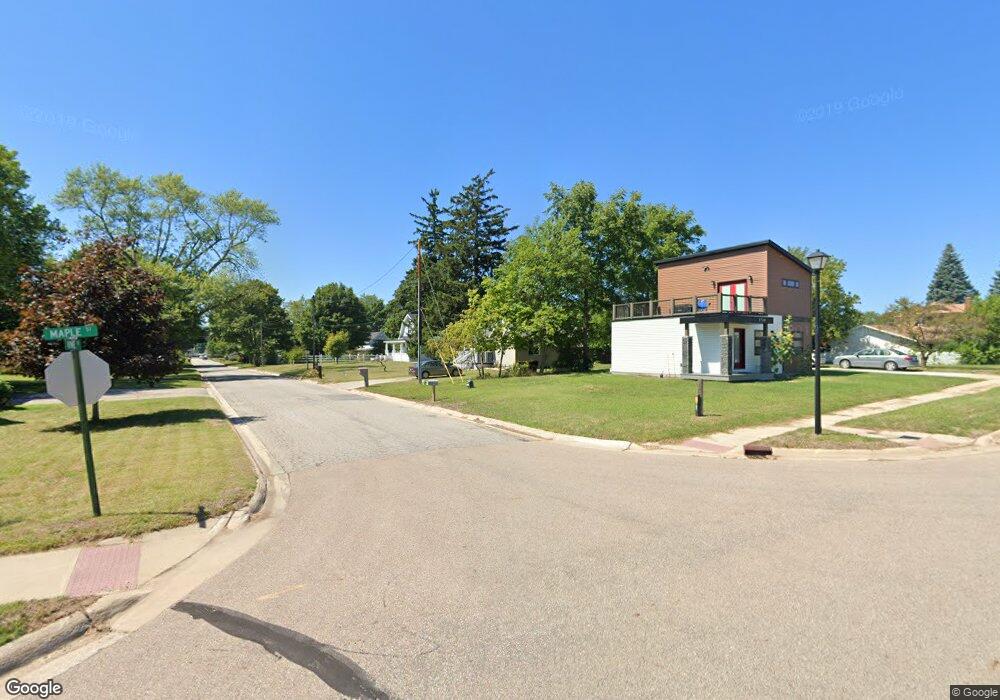
This home is located at 4273 Vine St, Bridgman, MI 49106 and is currently estimated at $188,454, approximately $253 per square foot. 4273 Vine St is a home located in Berrien County with nearby schools including Bridgman Elementary School, F.C. Reed Middle School, and Bridgman High School.
Ownership History
Date
Name
Owned For
Owner Type
Purchase Details
Closed on
Mar 28, 2024
Sold by
Dryden Caleb S
Bought by
Dryden Caleb S and Caleb S Dryden And Amanda J Dryden Revocable
Current Estimated Value
Purchase Details
Closed on
Mar 12, 2024
Sold by
Dryden Caleb S
Bought by
Dryden Caleb S and Caleb S Dryden And Amanda J Dryden Revocable
Purchase Details
Closed on
Sep 18, 2019
Sold by
Roehlerre John Joseph and Koehlee Michela Koe
Bought by
Dryoen Caleb
Purchase Details
Closed on
Jul 11, 2018
Sold by
Jay Klint Tobin and Jay Carrie L
Bought by
Koehler John and Koehler Michaela
Purchase Details
Closed on
Jul 6, 2018
Sold by
Klint Tobin Jay and Klint Carrie L
Bought by
Koehler John and Koehler Michaela
Purchase Details
Closed on
Mar 27, 2007
Sold by
Klint Tobin Jay and Klint Carrie L
Bought by
Klint Tobin Jay and Klint Carrie L
Home Financials for this Owner
Home Financials are based on the most recent Mortgage that was taken out on this home.
Original Mortgage
$69,600
Interest Rate
6.25%
Mortgage Type
New Conventional
Create a Home Valuation Report for This Property
The Home Valuation Report is an in-depth analysis detailing your home's value as well as a comparison with similar homes in the area
Purchase History
| Date | Buyer | Sale Price | Title Company |
|---|---|---|---|
| Dryden Caleb S | -- | None Listed On Document | |
| Dryden Caleb S | -- | None Listed On Document | |
| Dryoen Caleb | $88,500 | None Available | |
| Koehler John | $80,000 | First American Title | |
| Koehler John | $80,000 | First American Title | |
| Klint Tobin Jay | -- | None Available |
Source: Public Records
Mortgage History
| Date | Status | Borrower | Loan Amount |
|---|---|---|---|
| Previous Owner | Klint Tobin Jay | $69,600 |
Source: Public Records
Tax History
| Year | Tax Paid | Tax Assessment Tax Assessment Total Assessment is a certain percentage of the fair market value that is determined by local assessors to be the total taxable value of land and additions on the property. | Land | Improvement |
|---|---|---|---|---|
| 2025 | $2,172 | $67,500 | $0 | $0 |
| 2024 | $2,108 | $60,800 | $0 | $0 |
| 2023 | $1,865 | $48,400 | $0 | $0 |
| 2022 | $1,776 | $44,700 | $0 | $0 |
| 2021 | $1,761 | $46,200 | $11,700 | $34,500 |
| 2020 | $1,734 | $40,400 | $0 | $0 |
| 2019 | $1,267 | $36,600 | $0 | $0 |
| 2018 | $1,263 | $39,100 | $0 | $0 |
| 2017 | $1,242 | $37,000 | $0 | $0 |
| 2016 | $1,220 | $40,700 | $0 | $0 |
| 2015 | $1,216 | $41,300 | $0 | $0 |
| 2014 | $1,164 | $43,000 | $11,200 | $31,800 |
Source: Public Records
Map
Nearby Homes
- 9720 Baldwin Rd Unit 12
- 9720 Baldwin Rd Unit 11
- 0a Red Arrow Hwy
- 00 Red Arrow Hwy
- VL-0 Baldwin Rd
- 3926 Papalardo St
- 4043 Sugarsand Ln
- 4019 Sugarsand Ln
- 3995 Sugarsand Ln
- 3990 Sugarsand Ln
- 4596 Vista Dr
- 10067 Red Arrow Hwy
- 3728 Lake St
- 0 Twin Oaks Rd Unit 25051559
- 9847 Quail Run Ct
- 10045 Weko Dr
- 4173 Maplewood Rd
- 0 0a Linke Rd Rd
- 10299 Gast Rd
- 5797 Wildwood Dr
- 9740 Maple St
- 4289 Vine St
- 0 Vine St
- 4276 Lake St
- 9760 Maple St
- 4262 Lake St
- 4288 Vine St
- 4304 Lake St
- 4246 Lake St
- 9729 Vineyard St
- 9739 Maple St
- 0 Lake Haven St Unit 36458705
- 0 Lake Haven - Elements St Unit 36468712
- 0 Lake Haven - Elements St Unit 36500108
- 0 Lake Haven - Elements St Unit 36480323
- 0 Lake Haven - Elements St Unit 36464017
- 0 Lake Haven - Elements St Unit 36436744
- 0 Lake Haven - Elements St Unit 36487629
- 0 Lake Haven - Elements St Unit 36502946
- 0 Lake Haven - Elements St Unit 36460858
Your Personal Tour Guide
Ask me questions while you tour the home.