Estimated Value: $510,369 - $589,000
3
Beds
3
Baths
1,995
Sq Ft
$275/Sq Ft
Est. Value
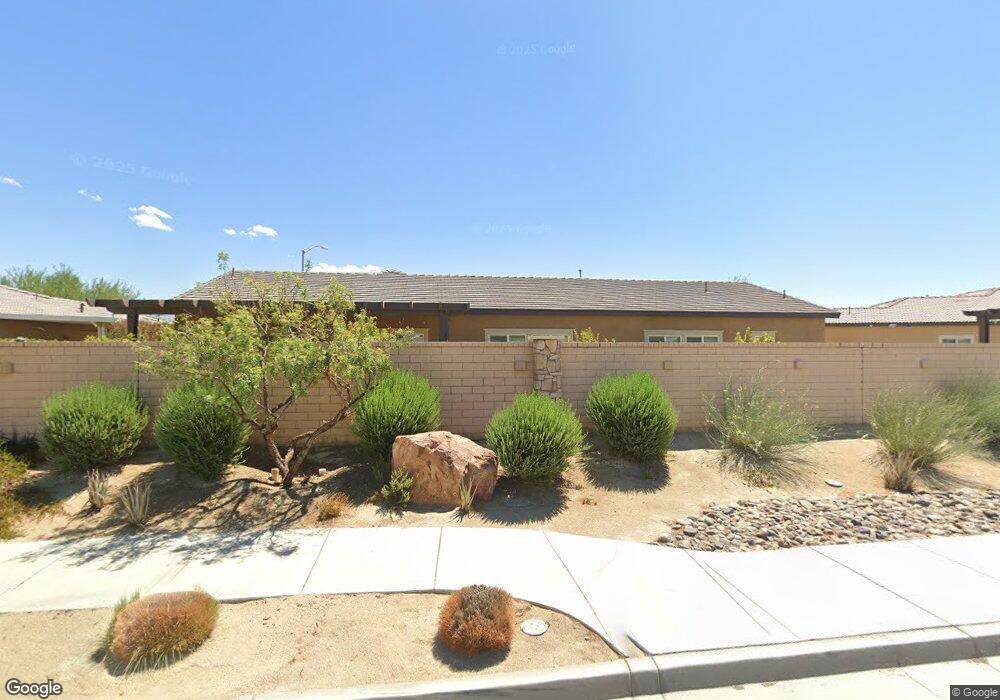
About This Home
This home is located at 42733 Saragoza Ct, Indio, CA 92203 and is currently estimated at $549,342, approximately $275 per square foot. 42733 Saragoza Ct is a home with nearby schools including Andrew Jackson Elementary School, Desert Ridge Academy, and Shadow Hills High School.
Ownership History
Date
Name
Owned For
Owner Type
Purchase Details
Closed on
Jan 28, 2019
Sold by
D R Horton Ca3 Inc
Bought by
Tapia Edward C and Tapia Yvonne A
Current Estimated Value
Home Financials for this Owner
Home Financials are based on the most recent Mortgage that was taken out on this home.
Original Mortgage
$311,818
Outstanding Balance
$274,144
Interest Rate
4.5%
Mortgage Type
FHA
Estimated Equity
$275,198
Purchase Details
Closed on
Mar 27, 2018
Sold by
Desert Hacienda Ii Group Llc
Bought by
D R Horton Ca3 Inc
Purchase Details
Closed on
May 19, 2011
Sold by
Hacienda Properties Inc
Bought by
Hacienda Ii Group Llc
Purchase Details
Closed on
Aug 18, 2009
Sold by
Scc Canyon Ii Llc
Bought by
Hacienda Properties Inc
Home Financials for this Owner
Home Financials are based on the most recent Mortgage that was taken out on this home.
Original Mortgage
$1,200,000
Interest Rate
5.17%
Mortgage Type
Purchase Money Mortgage
Create a Home Valuation Report for This Property
The Home Valuation Report is an in-depth analysis detailing your home's value as well as a comparison with similar homes in the area
Home Values in the Area
Average Home Value in this Area
Purchase History
| Date | Buyer | Sale Price | Title Company |
|---|---|---|---|
| Tapia Edward C | $318,000 | Fidelity National Title Grou | |
| D R Horton Ca3 Inc | $2,131,500 | First American Title Company | |
| Hacienda Ii Group Llc | -- | First American Title Company | |
| Hacienda Properties Inc | -- | First American Title Company |
Source: Public Records
Mortgage History
| Date | Status | Borrower | Loan Amount |
|---|---|---|---|
| Open | Tapia Edward C | $311,818 | |
| Previous Owner | Hacienda Properties Inc | $1,200,000 |
Source: Public Records
Tax History
| Year | Tax Paid | Tax Assessment Tax Assessment Total Assessment is a certain percentage of the fair market value that is determined by local assessors to be the total taxable value of land and additions on the property. | Land | Improvement |
|---|---|---|---|---|
| 2025 | $6,473 | $354,541 | $27,886 | $326,655 |
| 2023 | $6,473 | $340,775 | $26,804 | $313,971 |
| 2022 | $5,914 | $334,094 | $26,279 | $307,815 |
| 2021 | $5,739 | $327,544 | $25,764 | $301,780 |
| 2020 | $4,950 | $324,186 | $25,500 | $298,686 |
| 2019 | $1,837 | $70,125 | $70,125 | $0 |
| 2018 | $687 | $18,236 | $18,236 | $0 |
| 2017 | $678 | $17,879 | $17,879 | $0 |
| 2016 | $676 | $17,529 | $17,529 | $0 |
| 2015 | $665 | $17,267 | $17,267 | $0 |
| 2014 | $682 | $16,930 | $16,930 | $0 |
Source: Public Records
Map
Nearby Homes
- 83414 Skyline Trail Rd
- 83399 Wagon Rd
- 83740 Durazo Ln
- 83656 Fujiyama Dr
- 83315 Stagecoach Rd
- 83631 Himilaya Dr
- 83822 Collection Dr
- 42724 Tango Ct
- 0 Marble Dr Unit 25515243PS
- 43175 Avenida Estrella
- 42073 Hideaway St
- 83530 Fenton Ct
- 83773 Salva Ct
- 83814 Wolf Creek Rd
- 83930 Bridges Ct
- 83655 Lumley Ave
- 83950 Avenida Serena
- 84020 Colibri Ct
- 84136 Ave 44 587 Unit 587
- 84066 Olona Ct
- 42705 Saragoza Ct
- 42757 Saragoza Ct
- 42671 Saragoza Ct
- 83474 Iron Horse Rd
- 83471 Iron Horse Rd
- 42768 Saragoza Ct
- 42764 Saragoza Ct
- 42724 Saragoza Ct
- 42696 Saragoza Ct
- 42651 Saragoza Ct
- 83453 Iron Horse Rd
- 83458 Iron Horse Rd
- 42668 Saragoza Ct
- 0 Saragoza Ct
- 0 Vistana Ct
- 42646 Dixie Way
- 83454 Saddle Ranch Rd
- 42833 Vistana Ct
- 42627 Saragoza Ct
- 42723 Gazapo Ct
Your Personal Tour Guide
Ask me questions while you tour the home.