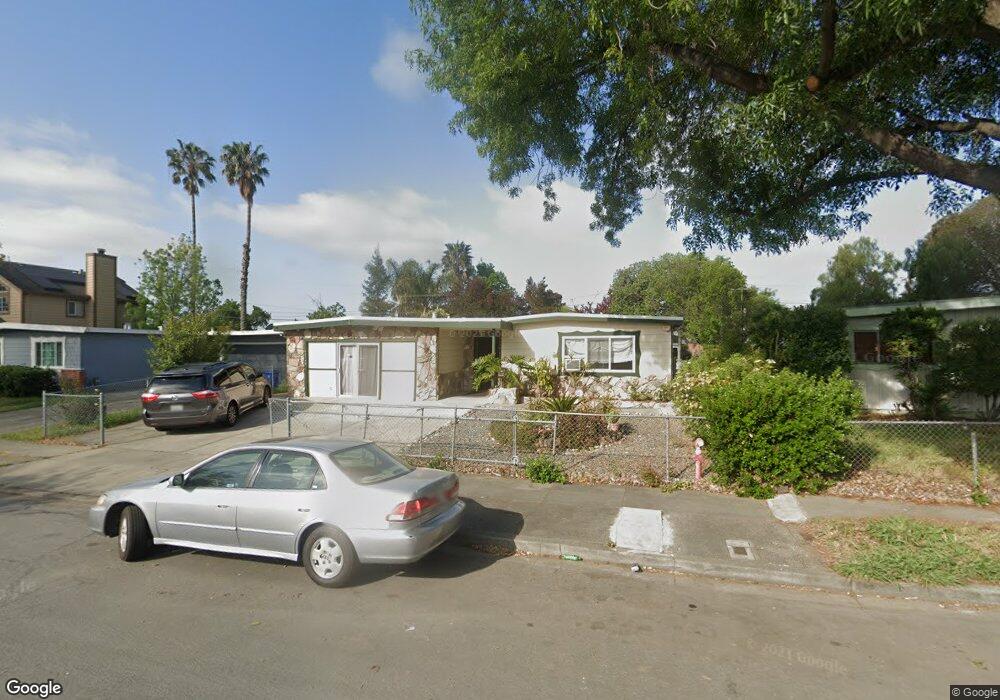
42745 Peachwood St Fremont, CA 94538
Grimmer NeighborhoodEstimated Value: $1,154,468
4
Beds
3
Baths
1,638
Sq Ft
$705/Sq Ft
Est. Value
About This Home
This home is located at 42745 Peachwood St, Fremont, CA 94538 and is currently estimated at $1,154,468, approximately $704 per square foot. 42745 Peachwood St is a home located in Alameda County with nearby schools including Harvey Green Elementary School, John M. Horner Junior High School, and Irvington High School.
Ownership History
Date
Name
Owned For
Owner Type
Purchase Details
Closed on
Sep 2, 2010
Sold by
Joe Isabella and Zhang Ge
Bought by
Joe Isabella
Current Estimated Value
Purchase Details
Closed on
Nov 20, 2003
Sold by
Logan Raymond and Logan Fenny S
Bought by
Zhang Ge and Isabella Joe
Home Financials for this Owner
Home Financials are based on the most recent Mortgage that was taken out on this home.
Original Mortgage
$356,800
Outstanding Balance
$149,429
Interest Rate
4.62%
Mortgage Type
Commercial
Estimated Equity
$1,005,039
Purchase Details
Closed on
May 8, 1998
Sold by
Delfierro Thelma
Bought by
Logan Raymond and Logan Fenny S
Home Financials for this Owner
Home Financials are based on the most recent Mortgage that was taken out on this home.
Original Mortgage
$198,000
Interest Rate
7.1%
Mortgage Type
Commercial
Purchase Details
Closed on
Sep 30, 1994
Sold by
Delfierro Dale and Delfierro Thelma
Bought by
Delfierro Thelma
Home Financials for this Owner
Home Financials are based on the most recent Mortgage that was taken out on this home.
Original Mortgage
$176,250
Interest Rate
6.8%
Mortgage Type
Commercial
Create a Home Valuation Report for This Property
The Home Valuation Report is an in-depth analysis detailing your home's value as well as a comparison with similar homes in the area
Home Values in the Area
Average Home Value in this Area
Purchase History
| Date | Buyer | Sale Price | Title Company |
|---|---|---|---|
| Joe Isabella | -- | None Available | |
| Zhang Ge | $446,000 | Chicago Title Company | |
| Logan Raymond | $220,000 | Financial Title Company | |
| Delfierro Thelma | -- | Fidelity National Title Ins |
Source: Public Records
Mortgage History
| Date | Status | Borrower | Loan Amount |
|---|---|---|---|
| Open | Zhang Ge | $356,800 | |
| Previous Owner | Logan Raymond | $198,000 | |
| Previous Owner | Delfierro Thelma | $176,250 | |
| Closed | Logan Raymond | $16,000 |
Source: Public Records
Tax History Compared to Growth
Tax History
| Year | Tax Paid | Tax Assessment Tax Assessment Total Assessment is a certain percentage of the fair market value that is determined by local assessors to be the total taxable value of land and additions on the property. | Land | Improvement |
|---|---|---|---|---|
| 2025 | $7,789 | $627,081 | $190,224 | $443,857 |
| 2024 | $7,789 | $614,651 | $186,495 | $435,156 |
| 2023 | $7,574 | $609,463 | $182,839 | $426,624 |
| 2022 | $7,467 | $590,514 | $179,254 | $418,260 |
| 2021 | $7,286 | $578,802 | $175,740 | $410,062 |
| 2020 | $7,279 | $579,800 | $173,940 | $405,860 |
| 2019 | $7,196 | $568,431 | $170,529 | $397,902 |
| 2018 | $7,054 | $557,285 | $167,185 | $390,100 |
| 2017 | $6,877 | $546,358 | $163,907 | $382,451 |
| 2016 | $6,756 | $535,645 | $160,693 | $374,952 |
| 2015 | $6,661 | $527,600 | $158,280 | $369,320 |
| 2014 | $6,543 | $517,265 | $155,179 | $362,086 |
Source: Public Records
Map
Nearby Homes
- 42932 Peachwood St
- 4309 Bora Ave
- 4533 Capewood Terrace
- 4537 Capewood Terrace
- 41882 Gifford St
- 4860 Bryce Canyon Park Dr
- 43163 Grimmer Terrace
- 92 Delta Green
- 42759 Newport Dr
- 48 Eagle Green
- 3872 Wildflower Common Unit 27
- 262 Manitoba Green
- 4751 Wadsworth Ct
- 5341 Audubon Park Ct
- 202 Manitoba Terrace
- 40696 Robin St
- 208 Manitoba Terrace
- 261 Manitoba Green Unit 261
- 257 Manitoba Green
- 3918 Fossano Common
- 42661 Peachwood St
- 42763 Peachwood St
- 42660 Applewood St
- 42726 Applewood St
- 42781 Peachwood St
- 42642 Applewood St
- 4402 Cherrywood Ave
- 4426 Cherrywood Ave
- 42744 Applewood St
- 42746 Peachwood St
- 42728 Peachwood St
- 42764 Peachwood St
- 42847 Peachwood St
- 4384 Cherrywood Ave
- 42624 Applewood St
- 42848 Peachwood St
- 4372 Cherrywood Ave
- 42865 Peachwood St
- 42828 Applewood St
- 42849 Wixon Dr