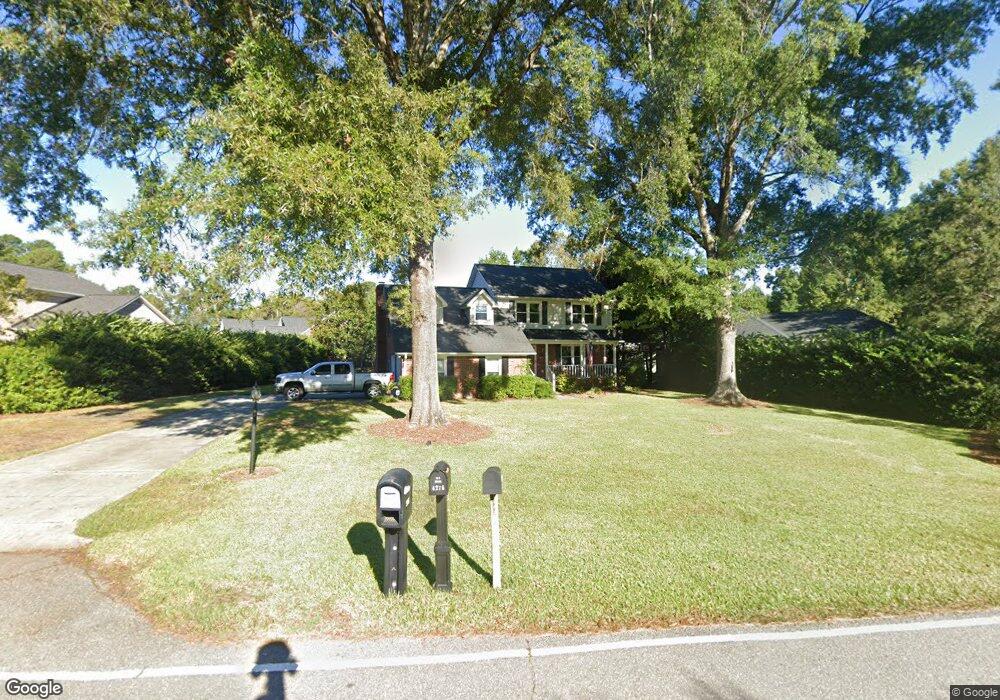
4275 Appleton Way Wilmington, NC 28412
Echo Farms-Rivers Edge NeighborhoodEstimated Value: $412,000 - $444,000
3
Beds
3
Baths
2,038
Sq Ft
$209/Sq Ft
Est. Value
About This Home
This home is located at 4275 Appleton Way, Wilmington, NC 28412 and is currently estimated at $425,698, approximately $208 per square foot. 4275 Appleton Way is a home located in New Hanover County with nearby schools including Edwin A. Alderman Elementary School, Williston Middle School, and New Hanover High School.
Ownership History
Date
Name
Owned For
Owner Type
Purchase Details
Closed on
Mar 9, 2016
Sold by
Marriott Erin Kae
Bought by
Marriott Kevin Lewis
Current Estimated Value
Purchase Details
Closed on
Mar 7, 2003
Sold by
Lee Charles Darcella
Bought by
Marriott Kevin L
Purchase Details
Closed on
Nov 1, 1996
Sold by
Duskey Michael E Rebecca A
Bought by
Lee Charles Darcella
Purchase Details
Closed on
Jun 28, 1991
Sold by
Bryant William L Nellie
Bought by
Duskey Michael E Rebecca A
Purchase Details
Closed on
Mar 16, 1989
Sold by
Palermo Fred J Julia L
Bought by
Bryant William L Nellie
Purchase Details
Closed on
Sep 1, 1986
Sold by
Roberts Neill A Shirley B
Bought by
Palermo Fred J Julia L
Purchase Details
Closed on
Dec 1, 1985
Sold by
Accent Builders Inc
Bought by
Roberts Neill A Shirley B
Purchase Details
Closed on
Oct 1, 1983
Sold by
Porter Lee W
Bought by
Accent Builders Inc
Purchase Details
Closed on
Jul 1, 1974
Bought by
Porter Lee W
Create a Home Valuation Report for This Property
The Home Valuation Report is an in-depth analysis detailing your home's value as well as a comparison with similar homes in the area
Home Values in the Area
Average Home Value in this Area
Purchase History
| Date | Buyer | Sale Price | Title Company |
|---|---|---|---|
| Marriott Kevin Lewis | -- | None Available | |
| Marriott Kevin L | $163,000 | -- | |
| Lee Charles Darcella | $141,000 | -- | |
| Duskey Michael E Rebecca A | $130,000 | -- | |
| Bryant William L Nellie | $119,000 | -- | |
| Palermo Fred J Julia L | $117,500 | -- | |
| Roberts Neill A Shirley B | -- | -- | |
| Accent Builders Inc | $11,000 | -- | |
| Porter Lee W | -- | -- |
Source: Public Records
Tax History Compared to Growth
Tax History
| Year | Tax Paid | Tax Assessment Tax Assessment Total Assessment is a certain percentage of the fair market value that is determined by local assessors to be the total taxable value of land and additions on the property. | Land | Improvement |
|---|---|---|---|---|
| 2025 | $2,163 | $374,700 | $95,400 | $279,300 |
| 2024 | $2,163 | $248,600 | $72,400 | $176,200 |
| 2023 | -- | $248,600 | $72,400 | $176,200 |
| 2022 | $0 | $248,600 | $72,400 | $176,200 |
| 2021 | $2,128 | $248,600 | $72,400 | $176,200 |
| 2020 | $2,524 | $239,600 | $69,900 | $169,700 |
| 2019 | $2,524 | $239,600 | $69,900 | $169,700 |
| 2018 | $2,524 | $239,600 | $69,900 | $169,700 |
| 2017 | $2,524 | $239,600 | $69,900 | $169,700 |
| 2016 | $2,420 | $218,400 | $69,900 | $148,500 |
| 2015 | $2,313 | $218,400 | $69,900 | $148,500 |
| 2014 | $2,215 | $218,400 | $69,900 | $148,500 |
Source: Public Records
Map
Nearby Homes
- 108 Hedingham Ct
- 3628 Daufuskie Dr
- 4031 Appleton Way
- 1114 Mccarley Blvd
- 318 Hedingham Ln
- 1012 Balfoure Dr
- 4236 Winding Branches Dr
- 1006 Ryans Ct
- 3241 Penzance Row
- 4158 Breezewood Dr Unit 203
- 4621 Pineview Dr
- 4156 Breezewood Dr Unit 102
- 4809 Indian Trail
- 801 Saint Andrews Dr
- 4912 Split Rail Dr
- 4228 Tillson Rd
- 3721 Sand Trap Ct
- 305 Saint Annes Moor
- 4907 Gate Post Ln
- 733 Shawnee Trail
- 4271 Appleton Way
- 4279 Appleton Way
- 307 Chatham Place
- 4280 Appleton Way
- 301 Chatham Place
- 4265 Appleton Way
- 4276 Appleton Way
- 4272 Appleton Way
- 308 Chatham Place
- 4307 Appleton Way
- 304 Chatham Place
- 4262 Appleton Way
- 4304 Appleton Way
- 4282 Appleton Way
- 4259 Appleton Way
- 4311 Appleton Way
- 4258 Appleton Way
- 4258 Appleton Way
- 305 Cheshire Place
- 4308 Appleton Way