F
Landlord's Agent in 2012
Francis Shim
Shim Realty
Estimated Value: $496,386 - $516,000
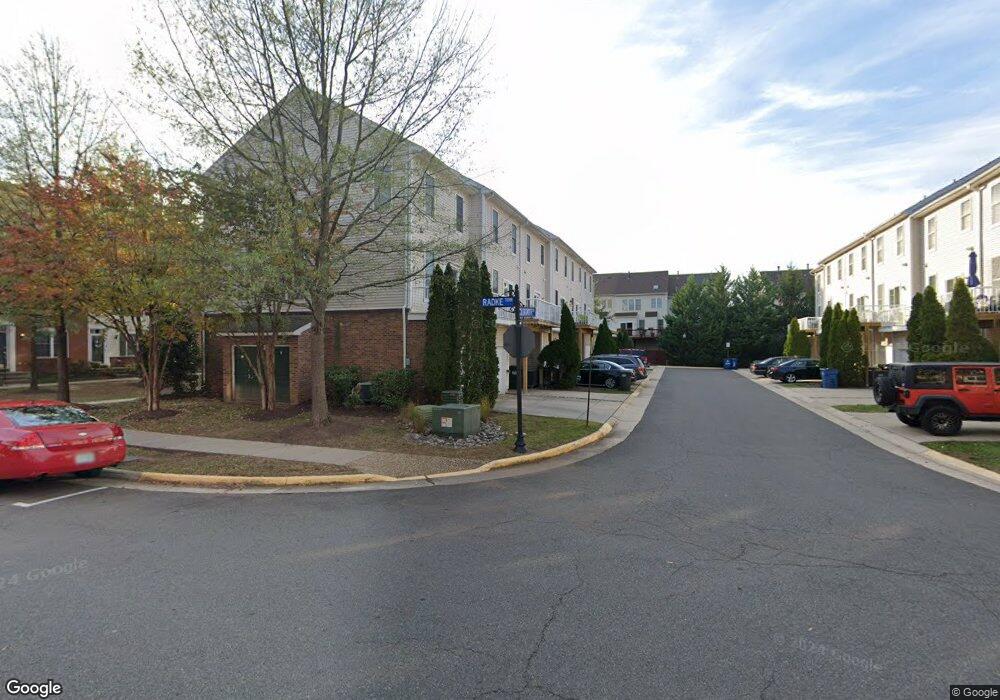
3 LEVEL 3 BR, 3.5 BA TH-2 Master suite w/ 3rd BR on lower level in the lovely Community of South Riding. It has a one car Garage. Pets are allowed as case by case with $500 pets deposit. Very Convenient location closed to everything that you need.
Last Agent to Rent the Property
Francis Shim
(571) 238-8307 francis.shim@theshimgroup.com Shim Realty Listed on: 01/21/2012
Last Renter's Agent
(571) 358-7244 william.davenport@cbmove.com Coldwell Banker Realty License #0225201050

| Date | Buyer | Sale Price | Title Company |
|---|---|---|---|
| Federal National Mortgage Association | $339,662 | -- | |
| Ahmad Ijaz | $344,575 | -- |
| Date | Status | Borrower | Loan Amount |
|---|---|---|---|
| Previous Owner | Ahmad Ijaz | $280,000 |
| Date | Event | Price | List to Sale | Price per Sq Ft | Prior Sale |
|---|---|---|---|---|---|
| 03/27/2012 03/27/12 | Rented | $1,830 | 0.0% | -- | |
| 03/27/2012 03/27/12 | Under Contract | -- | -- | -- | |
| 01/21/2012 01/21/12 | For Rent | $1,830 | 0.0% | -- | |
| 01/18/2012 01/18/12 | Sold | $252,000 | -2.7% | $219 / Sq Ft | View Prior Sale |
| 11/29/2011 11/29/11 | Pending | -- | -- | -- | |
| 11/15/2011 11/15/11 | Price Changed | $259,000 | -10.4% | $225 / Sq Ft | |
| 10/05/2011 10/05/11 | For Sale | $289,000 | -- | $251 / Sq Ft |
| Year | Tax Paid | Tax Assessment Tax Assessment Total Assessment is a certain percentage of the fair market value that is determined by local assessors to be the total taxable value of land and additions on the property. | Land | Improvement |
|---|---|---|---|---|
| 2025 | $3,893 | $483,570 | $150,000 | $333,570 |
| 2024 | $3,943 | $455,850 | $140,000 | $315,850 |
| 2023 | $3,632 | $415,090 | $140,000 | $275,090 |
| 2022 | $3,533 | $396,960 | $125,000 | $271,960 |
| 2021 | $3,516 | $358,730 | $110,000 | $248,730 |
| 2020 | $3,587 | $346,550 | $110,000 | $236,550 |
| 2019 | $3,426 | $327,820 | $110,000 | $217,820 |
| 2018 | $3,385 | $311,980 | $110,000 | $201,980 |
| 2017 | $3,315 | $294,650 | $110,000 | $184,650 |
| 2016 | $3,334 | $291,170 | $0 | $0 |
| 2015 | $3,395 | $189,110 | $0 | $189,110 |
| 2014 | $3,440 | $187,850 | $0 | $187,850 |
F
Landlord's Agent in 2012
Francis Shim
Shim Realty
Seller's Agent in 2012
Leo Pareja
Leo Pareja Referral Company
(703) 646-7522
Seller Co-Listing Agent in 2012
Trevor Moore
Compass
(703) 915-0869
1 in this area
105 Total Sales
Tenant's Agent in 2012
William Davenport
Coldwell Banker (NRT-Southeast-MidAtlantic)
(571) 358-7244
16 Total Sales
Source: Bright MLS
MLS Number: 1003826254
APN: 165-38-6830-004
Disclaimer: Certain information contained herein is derived from information provided by parties other than Homes.com. All information provided is deemed reliable, but is not guaranteed to be accurate and should be independently verified.
![]() The data relating to real estate for sale on this website appears in part through the BRIGHT Internet Data Exchange program, a voluntary cooperative exchange of property listing data between licensed real estate brokerage firms, and is provided by BRIGHT through a licensing agreement.
The data relating to real estate for sale on this website appears in part through the BRIGHT Internet Data Exchange program, a voluntary cooperative exchange of property listing data between licensed real estate brokerage firms, and is provided by BRIGHT through a licensing agreement.
Listing information is from various brokers who participate in the Bright MLS IDX program and not all listings may be visible on the site.
The property information being provided on or through the website is for the personal, non-commercial use of consumers and such information may not be used for any purpose other than to identify prospective properties consumers may be interested in purchasing.
Some properties which appear for sale on the website may no longer be available because they are for instance, under contract, sold or are no longer being offered for sale.
Property information displayed is deemed reliable but is not guaranteed.
Copyright 2025 Bright MLS, Inc.