Estimated Value: $428,000 - $456,000
5
Beds
3
Baths
3,329
Sq Ft
$133/Sq Ft
Est. Value
About This Home
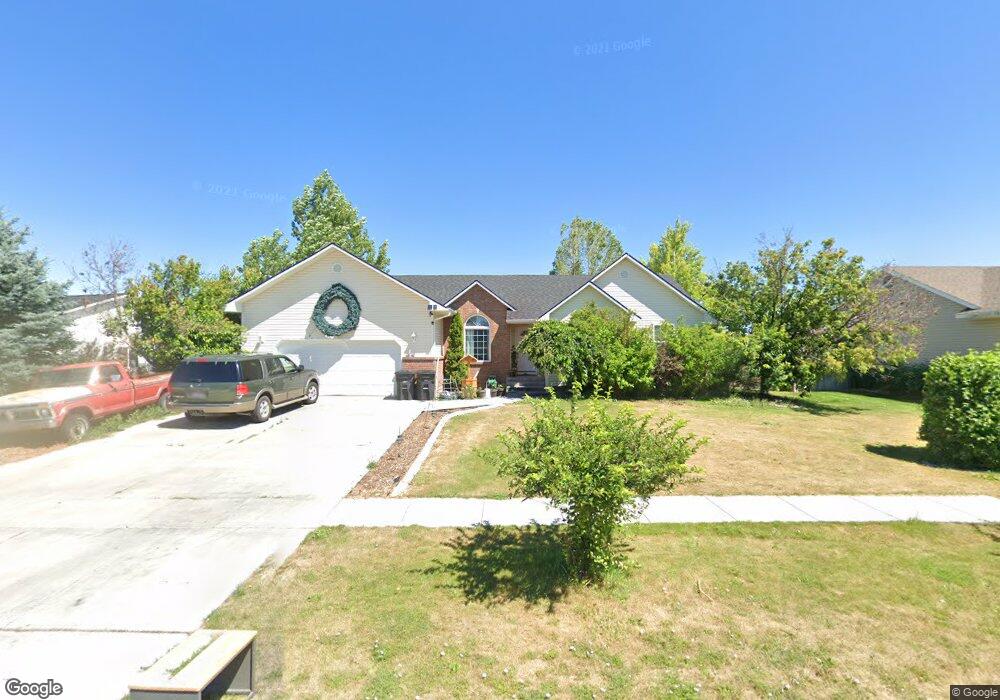
This home is located at 4277 Christy Ln, Ammon, ID 83406 and is currently estimated at $441,339, approximately $132 per square foot. 4277 Christy Ln is a home located in Bonneville County with nearby schools including Hillview Elementary School, Sandcreek Middle School, and Hillcrest High School.
Ownership History
Date
Name
Owned For
Owner Type
Purchase Details
Closed on
Jan 19, 2021
Sold by
Walker Tyson and Walker Sabrina Alene
Bought by
Walker Tyson J and Walker Sabrina A
Current Estimated Value
Home Financials for this Owner
Home Financials are based on the most recent Mortgage that was taken out on this home.
Original Mortgage
$280,000
Outstanding Balance
$249,901
Interest Rate
2.71%
Mortgage Type
New Conventional
Estimated Equity
$191,438
Purchase Details
Closed on
Sep 27, 2019
Sold by
Walker Tyson and Walker Sabrina
Bought by
Walker Tyson and Walker Sabrina Alene
Home Financials for this Owner
Home Financials are based on the most recent Mortgage that was taken out on this home.
Original Mortgage
$236,000
Interest Rate
3.5%
Mortgage Type
New Conventional
Purchase Details
Closed on
May 8, 2006
Sold by
Huls Patrick and Huls Jennifer
Bought by
Walker Tyson and Walker Sabrina
Home Financials for this Owner
Home Financials are based on the most recent Mortgage that was taken out on this home.
Original Mortgage
$19,000
Interest Rate
6.29%
Mortgage Type
Stand Alone Second
Create a Home Valuation Report for This Property
The Home Valuation Report is an in-depth analysis detailing your home's value as well as a comparison with similar homes in the area
Home Values in the Area
Average Home Value in this Area
Purchase History
| Date | Buyer | Sale Price | Title Company |
|---|---|---|---|
| Walker Tyson J | -- | Titleone Twin Falls | |
| Walker Tyson | -- | Titleone Boise | |
| Walker Tyson | -- | None Available |
Source: Public Records
Mortgage History
| Date | Status | Borrower | Loan Amount |
|---|---|---|---|
| Open | Walker Tyson J | $280,000 | |
| Closed | Walker Tyson | $236,000 | |
| Closed | Walker Tyson | $19,000 |
Source: Public Records
Tax History Compared to Growth
Tax History
| Year | Tax Paid | Tax Assessment Tax Assessment Total Assessment is a certain percentage of the fair market value that is determined by local assessors to be the total taxable value of land and additions on the property. | Land | Improvement |
|---|---|---|---|---|
| 2025 | $1,843 | $482,160 | $92,650 | $389,510 |
| 2024 | $1,843 | $494,400 | $92,650 | $401,750 |
| 2023 | $1,577 | $390,740 | $94,350 | $296,390 |
| 2022 | $1,756 | $335,665 | $62,985 | $272,680 |
| 2021 | $1,627 | $264,245 | $57,205 | $207,040 |
| 2019 | $1,727 | $222,565 | $49,725 | $172,840 |
| 2018 | $1,398 | $223,305 | $39,865 | $183,440 |
| 2017 | $1,295 | $192,165 | $26,435 | $165,730 |
| 2016 | $1,249 | $177,880 | $23,970 | $153,910 |
| 2015 | $1,184 | $164,910 | $23,970 | $140,940 |
| 2014 | $29,962 | $164,910 | $23,970 | $140,940 |
| 2013 | $1,140 | $161,390 | $23,970 | $137,420 |
Source: Public Records
Map
Nearby Homes
- 1257 Newgate Dr
- 3935 John Adams Pkwy
- 3818 Silverwood Cir
- 995 Edinburg Cir
- 3790 Briar Creek Cir
- 1911 Eagle Pointe Ct
- 4177 Bracken Way
- 1880 Bellagio Dr
- 1759 Bellagio Dr
- 1521 S Bergamo Dr
- TBD Crowley Rd
- 2163 Dakota Ln
- 3648 Ellendale Cir
- 4922 Torcello Dr
- 169 Robison Dr
- 1981 Bellagio Dr
- 1038 Villa Vista Dr
- 255 N Farnsworth Dr
- 273 Creighton Way
- 167 S Heath Ln
- 4255 Christy Ln
- 4280 Christy Ln
- 4258 Christy Ln
- 4297 Christy Ln
- 4296 Christy Ln
- 4315 Christy Ln
- 4254 E Amber Ln
- 4223 Christy Ln
- 4298 Amber Ln
- 4224 Christy Ln
- 4316 Christy Ln
- 4276 Amber Ln
- 4254 Amber Ln
- 4314 Amber Ln
- 4279 Mirinda Ln
- 4333 Christy Ln
- 4257 Mirinda Ln
- 4299 Mirinda Ln
- 4334 Christy Ln
- 4220 E Amber Ln