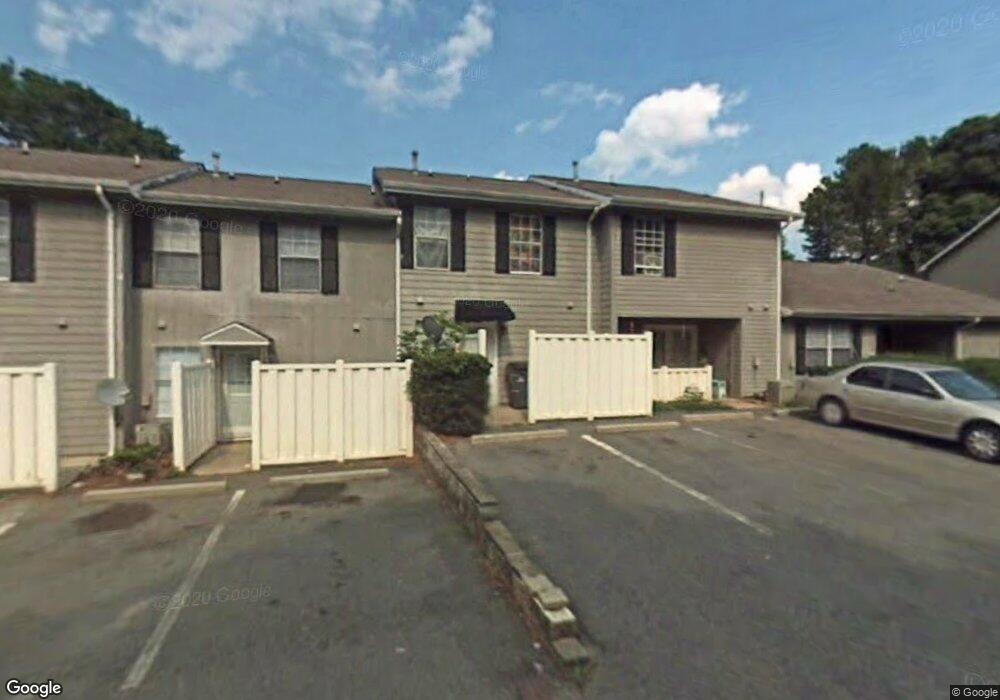
4279 Grogan St NW Unit 4350 Acworth, GA 30101
Estimated Value: $203,402 - $214,000
2
Beds
2
Baths
1,080
Sq Ft
$192/Sq Ft
Est. Value
About This Home
This home is located at 4279 Grogan St NW Unit 4350, Acworth, GA 30101 and is currently estimated at $207,601, approximately $192 per square foot. 4279 Grogan St NW Unit 4350 is a home located in Cobb County with nearby schools including Acworth Intermediate School, McCall Primary School, and Barber Middle School.
Ownership History
Date
Name
Owned For
Owner Type
Purchase Details
Closed on
Aug 13, 2010
Sold by
Key Prop Solutions Llc
Bought by
Campbell Pollyann S
Current Estimated Value
Purchase Details
Closed on
Jun 1, 2010
Sold by
Key Prop Solutions Llc
Bought by
Key Prop Solutions Llc
Purchase Details
Closed on
May 16, 2007
Sold by
Us Bank Natl Assoc
Bought by
Carania Anthony and Carania Ana
Home Financials for this Owner
Home Financials are based on the most recent Mortgage that was taken out on this home.
Original Mortgage
$47,920
Interest Rate
6.16%
Mortgage Type
New Conventional
Purchase Details
Closed on
Dec 5, 2006
Sold by
Oliver Rodrick
Bought by
U S Bank Natl Assoc
Purchase Details
Closed on
Apr 27, 2005
Sold by
United Housing Acworth Llc
Bought by
Oliver Rodrick
Home Financials for this Owner
Home Financials are based on the most recent Mortgage that was taken out on this home.
Original Mortgage
$99,000
Interest Rate
8.25%
Mortgage Type
New Conventional
Create a Home Valuation Report for This Property
The Home Valuation Report is an in-depth analysis detailing your home's value as well as a comparison with similar homes in the area
Home Values in the Area
Average Home Value in this Area
Purchase History
| Date | Buyer | Sale Price | Title Company |
|---|---|---|---|
| Campbell Pollyann S | $33,000 | -- | |
| Key Prop Solutions Llc | -- | -- | |
| Key Properties Solutions Llc | $20,000 | -- | |
| Carania Anthony | $59,900 | -- | |
| U S Bank Natl Assoc | $52,000 | -- | |
| Oliver Rodrick | $123,800 | -- |
Source: Public Records
Mortgage History
| Date | Status | Borrower | Loan Amount |
|---|---|---|---|
| Previous Owner | Carania Anthony | $47,920 | |
| Previous Owner | Oliver Rodrick | $99,000 |
Source: Public Records
Tax History Compared to Growth
Tax History
| Year | Tax Paid | Tax Assessment Tax Assessment Total Assessment is a certain percentage of the fair market value that is determined by local assessors to be the total taxable value of land and additions on the property. | Land | Improvement |
|---|---|---|---|---|
| 2024 | $1,656 | $54,936 | $10,000 | $44,936 |
| 2023 | $1,656 | $54,936 | $10,000 | $44,936 |
| 2022 | $1,667 | $54,936 | $10,000 | $44,936 |
| 2021 | $1,199 | $39,520 | $10,000 | $29,520 |
| 2020 | $1,577 | $39,520 | $10,000 | $29,520 |
| 2019 | $971 | $31,988 | $7,200 | $24,788 |
| 2018 | $884 | $29,124 | $8,000 | $21,124 |
| 2017 | $798 | $27,756 | $8,000 | $19,756 |
| 2016 | $527 | $18,320 | $4,000 | $14,320 |
| 2015 | $540 | $18,320 | $4,000 | $14,320 |
| 2014 | $392 | $13,200 | $0 | $0 |
Source: Public Records
Map
Nearby Homes
- 4270 S Main St
- 4128 Worth St NW
- 4269 Westside Dr
- 4384 Westside Dr
- 4478 Pelham Dr
- 4329 Park St
- 4553 Spring St
- 4562 Spring St
- 4610 Old Cowan Rd
- 3615 High Battery Bluff NW
- 4304 Hill View Dr
- 4199 Elderberry Dr NW
- 4091 Fort Sumter Landing NW
- 3943 Henry Ct
- 3949 Golflinks Dr NW
- 4308 Southside Dr
- 3937 Golflinks Dr NW
- 4281 Grogan St NW
- 4281 Grogan St NW Unit 4281
- 4283 Grogan St NW
- 4277 Grogan St NW
- 4285 Grogan St NW Unit 4382
- 4287 Grogan St NW Unit 4392
- 4287 Grogan St NW Unit 4287
- 4275 Grogan St NW Unit 4332
- 4289 Grogan St NW Unit 4404
- 4289 Grogan St NW Unit 4289
- 4291 Grogan St NW Unit 4414
- 4267 Grogan St NW Unit 4267
- 4267 Grogan St NW Unit 4296
- 4267 Grogan St NW
- 4246 Worth St NW
- 4265 Grogan St NW
- 4273 Grogan St NW
- 4273 Grogan St NW
- 4263 Grogan St NW Unit 4268
- 4263 Grogan St NW