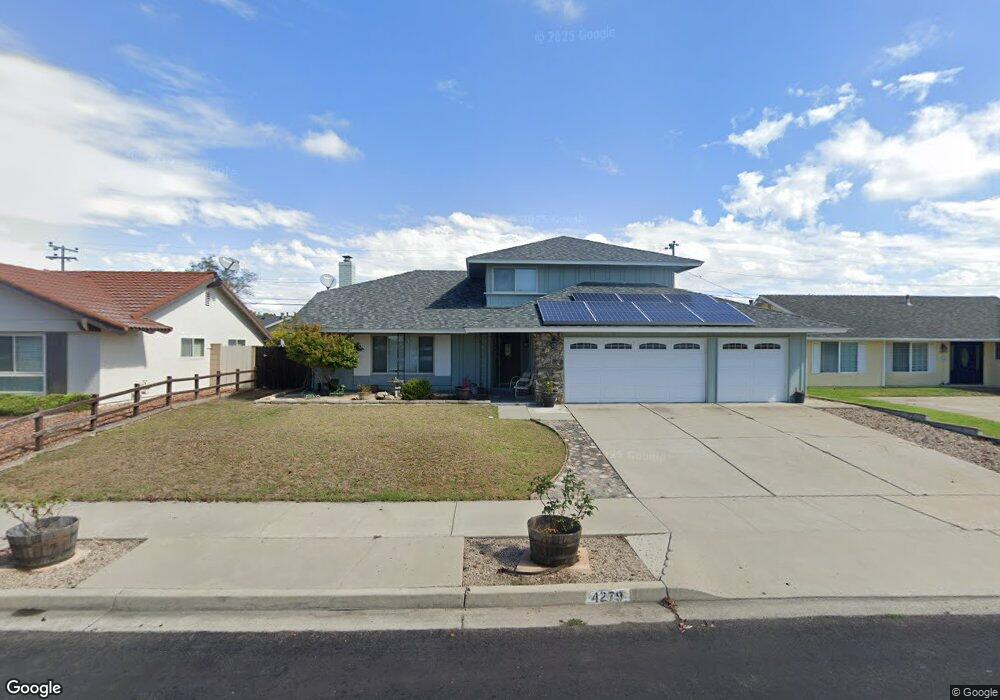
4279 Polaris Ave Lompoc, CA 93436
Estimated Value: $690,000 - $732,000
4
Beds
3
Baths
2,162
Sq Ft
$328/Sq Ft
Est. Value
About This Home
This home is located at 4279 Polaris Ave, Lompoc, CA 93436 and is currently estimated at $708,251, approximately $327 per square foot. 4279 Polaris Ave is a home located in Santa Barbara County with nearby schools including Buena Vista Elementary School, Cabrillo High School, and Olive Grove Charter - Lompoc.
Ownership History
Date
Name
Owned For
Owner Type
Purchase Details
Closed on
Feb 3, 2020
Sold by
Taylor Timothy C
Bought by
Buhring Megan
Current Estimated Value
Home Financials for this Owner
Home Financials are based on the most recent Mortgage that was taken out on this home.
Original Mortgage
$368,000
Outstanding Balance
$325,838
Interest Rate
3.6%
Mortgage Type
New Conventional
Estimated Equity
$382,413
Purchase Details
Closed on
Apr 26, 2002
Sold by
Wood Leonard E and Wood Kristin L
Bought by
Taylor Timothy C
Home Financials for this Owner
Home Financials are based on the most recent Mortgage that was taken out on this home.
Original Mortgage
$237,200
Interest Rate
6.74%
Create a Home Valuation Report for This Property
The Home Valuation Report is an in-depth analysis detailing your home's value as well as a comparison with similar homes in the area
Home Values in the Area
Average Home Value in this Area
Purchase History
| Date | Buyer | Sale Price | Title Company |
|---|---|---|---|
| Buhring Megan | $460,000 | First American Title Company | |
| Taylor Timothy C | $296,500 | Stewart Title |
Source: Public Records
Mortgage History
| Date | Status | Borrower | Loan Amount |
|---|---|---|---|
| Open | Buhring Megan | $368,000 | |
| Previous Owner | Taylor Timothy C | $237,200 |
Source: Public Records
Tax History
| Year | Tax Paid | Tax Assessment Tax Assessment Total Assessment is a certain percentage of the fair market value that is determined by local assessors to be the total taxable value of land and additions on the property. | Land | Improvement |
|---|---|---|---|---|
| 2025 | $5,714 | $503,073 | $125,767 | $377,306 |
| 2023 | $5,714 | $483,539 | $120,884 | $362,655 |
| 2022 | $5,622 | $474,059 | $118,514 | $355,545 |
| 2021 | $5,682 | $464,765 | $116,191 | $348,574 |
| 2020 | $5,014 | $400,496 | $108,055 | $292,441 |
| 2019 | $4,858 | $392,644 | $105,937 | $286,707 |
| 2018 | $4,788 | $384,946 | $103,860 | $281,086 |
| 2017 | $4,272 | $348,000 | $134,000 | $214,000 |
| 2016 | $3,632 | $316,000 | $122,000 | $194,000 |
| 2014 | $3,324 | $286,000 | $110,000 | $176,000 |
Source: Public Records
Map
Nearby Homes
- 232 Vega Ave
- 113 Gemini Ave
- 4490 Sirius Ave
- 106 Galaxy Way Unit 3
- 3939 Mesa Circle Dr
- 372 Oak Hill Dr
- 240 Oak Hill Dr
- 0 Oak Hill Dr Unit 24-783
- 250 Saint Andrews Way
- 649 Burning Tree Way
- 3834 Jupiter Ave
- 3725 Jupiter Ave
- 758 Voyager Rd
- 1445 Calle Marana
- 3660 Rucker Rd
- 972 Pellham Dr
- 533 Live Oak Rd
- 1735 River Vista Way
- 535 Live Oak Rd
- 1712 River Vista Way
- 4271 Polaris Ave
- 4289 Polaris Ave
- 4280 Constellation Rd
- 4290 Constellation Rd
- 4270 Constellation Rd
- 4261 Polaris Ave
- 4270 Polaris Ave
- 4290 Polaris Ave
- 4260 Constellation Rd
- 4260 Polaris Ave
- 4344 Sirius Ave
- 4336 Sirius Ave
- 4312 Constellation Rd
- 4328 Sirius Ave
- 4250 Polaris Ave
- 208 Pegasus Ave
- 4250 Constellation Rd Unit 1
- 214 Pegasus Ave
Your Personal Tour Guide
Ask me questions while you tour the home.