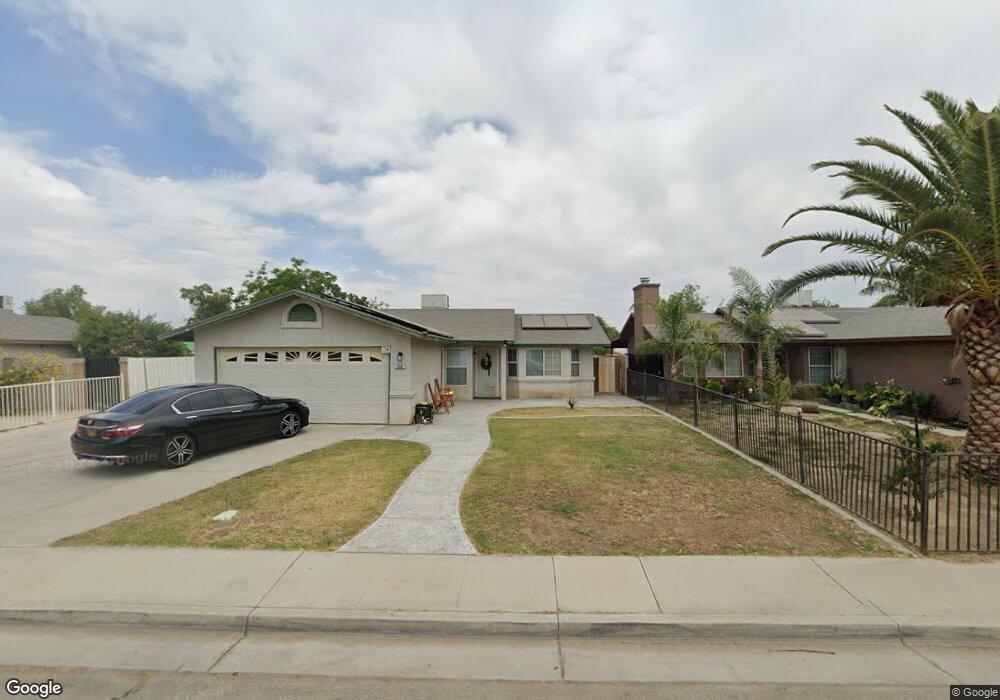
428 11th St Mc Farland, CA 93250
Estimated Value: $250,000 - $322,000
3
Beds
2
Baths
1,097
Sq Ft
$257/Sq Ft
Est. Value
About This Home
This home is located at 428 11th St, Mc Farland, CA 93250 and is currently estimated at $281,610, approximately $256 per square foot. 428 11th St is a home located in Kern County with nearby schools including McFarland High School.
Ownership History
Date
Name
Owned For
Owner Type
Purchase Details
Closed on
Oct 6, 2021
Sold by
Duncan Trudie Lou
Bought by
Garcia Jose Refugio Rodriguez
Current Estimated Value
Home Financials for this Owner
Home Financials are based on the most recent Mortgage that was taken out on this home.
Original Mortgage
$97,500
Outstanding Balance
$89,179
Interest Rate
3.01%
Mortgage Type
New Conventional
Estimated Equity
$192,431
Purchase Details
Closed on
Jul 2, 2019
Sold by
Duncan Trudie Lou and Duncan Trudy Lou
Bought by
Duncan Trudie Lou
Purchase Details
Closed on
Jun 10, 2019
Sold by
Duncan Donald and Duncan Kim
Bought by
Duncan Trudie Lou
Purchase Details
Closed on
Feb 2, 2013
Sold by
Duncan Trudy Lou
Bought by
Embrey Gwen and Duncan Donald
Purchase Details
Closed on
Jan 18, 1999
Sold by
Duncan Trudie Lou and Duncan Leanna
Bought by
Duncan Trudie Lou
Purchase Details
Closed on
Nov 11, 1998
Sold by
4 H Development Inc
Bought by
Duncan Trudie Lou and Duncan Leanna
Home Financials for this Owner
Home Financials are based on the most recent Mortgage that was taken out on this home.
Original Mortgage
$42,800
Interest Rate
6.54%
Create a Home Valuation Report for This Property
The Home Valuation Report is an in-depth analysis detailing your home's value as well as a comparison with similar homes in the area
Home Values in the Area
Average Home Value in this Area
Purchase History
| Date | Buyer | Sale Price | Title Company |
|---|---|---|---|
| Garcia Jose Refugio Rodriguez | $130,000 | First American Title Company | |
| Duncan Trudie Lou | -- | Chicago Title Company | |
| Duncan Trudie Lou | -- | Chicago Title Company | |
| Embrey Gwen | -- | None Available | |
| Duncan Trudie Lou | -- | -- | |
| Duncan Trudie Lou | $78,000 | American Title Co |
Source: Public Records
Mortgage History
| Date | Status | Borrower | Loan Amount |
|---|---|---|---|
| Open | Garcia Jose Refugio Rodriguez | $97,500 | |
| Previous Owner | Duncan Trudie Lou | $42,800 |
Source: Public Records
Tax History
| Year | Tax Paid | Tax Assessment Tax Assessment Total Assessment is a certain percentage of the fair market value that is determined by local assessors to be the total taxable value of land and additions on the property. | Land | Improvement |
|---|---|---|---|---|
| 2025 | $2,187 | $176,159 | $53,060 | $123,099 |
| 2024 | $2,153 | $172,706 | $52,020 | $120,686 |
| 2023 | $2,153 | $169,320 | $51,000 | $118,320 |
| 2022 | $2,103 | $166,000 | $50,000 | $116,000 |
| 2021 | $1,805 | $144,023 | $34,180 | $109,843 |
| 2020 | $1,805 | $142,547 | $33,830 | $108,717 |
| 2019 | $1,310 | $111,653 | $21,496 | $90,157 |
| 2018 | $1,294 | $107,319 | $20,662 | $86,657 |
| 2017 | $1,262 | $105,215 | $20,257 | $84,958 |
| 2016 | $1,245 | $103,153 | $19,860 | $83,293 |
| 2015 | $1,223 | $101,604 | $19,562 | $82,042 |
| 2014 | $1,172 | $99,614 | $19,179 | $80,435 |
Source: Public Records
Map
Nearby Homes
- 314 8th St
- 617 7th St
- 733 Ensenata Dr
- 0 W Sherwood Ave Unit 202506495
- 0 W Sherwood Ave Unit 21453658
- 124 4th Place
- 737 Misty Ave
- 249 Robertson Ave
- 13271 Garzoli Ave
- 830 Davis Ave
- 737 Concord Ct
- 799 Moscato St
- 583 Taylor Ave
- 1043 Moscato St
- 276 San Juan St
- 30787 Perkins Ave
- 254 E Sherwood Ave
- 852 Butte St
- 216 Browning Rd
- 1085 Mast Ave
Your Personal Tour Guide
Ask me questions while you tour the home.