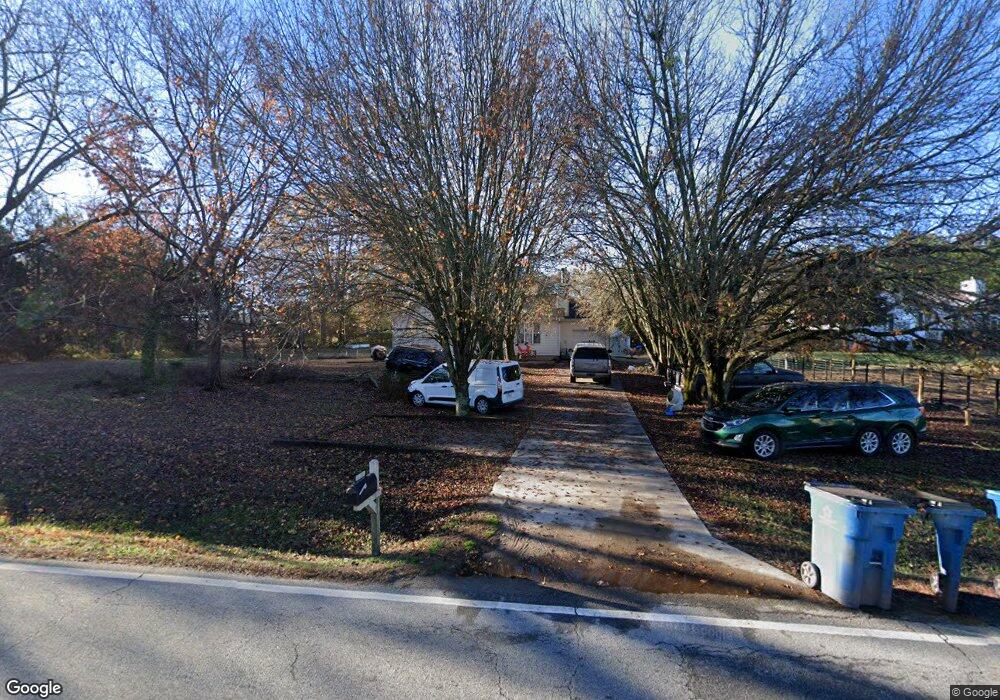
428 Carl Bethlehem Rd SW Bethlehem, GA 30620
Estimated Value: $251,788 - $283,000
3
Beds
2
Baths
1,152
Sq Ft
$232/Sq Ft
Est. Value
About This Home
This home is located at 428 Carl Bethlehem Rd SW, Bethlehem, GA 30620 and is currently estimated at $267,197, approximately $231 per square foot. 428 Carl Bethlehem Rd SW is a home located in Barrow County with nearby schools including Bethlehem Elementary School, Haymon-Morris Middle School, and Apalachee High School.
Ownership History
Date
Name
Owned For
Owner Type
Purchase Details
Closed on
Apr 9, 2021
Sold by
Jaco Bros Investments Llc
Bought by
Tejada Carlos
Current Estimated Value
Home Financials for this Owner
Home Financials are based on the most recent Mortgage that was taken out on this home.
Original Mortgage
$178,062
Outstanding Balance
$160,897
Interest Rate
3.05%
Mortgage Type
New Conventional
Estimated Equity
$106,300
Purchase Details
Closed on
Feb 14, 2013
Sold by
Deutsche Bank National Trust C
Bought by
Jaco Bros Investments Llc
Purchase Details
Closed on
Jul 3, 2012
Sold by
Carroll Dawn K
Bought by
Deutsche Bank National Trust C and Fremont Home Loan Trust
Purchase Details
Closed on
Jul 22, 2002
Sold by
Carroll Michael Will
Bought by
Carroll Michael Will
Purchase Details
Closed on
Oct 6, 1995
Sold by
Hardegree Harris
Bought by
Evans Allen April
Create a Home Valuation Report for This Property
The Home Valuation Report is an in-depth analysis detailing your home's value as well as a comparison with similar homes in the area
Home Values in the Area
Average Home Value in this Area
Purchase History
| Date | Buyer | Sale Price | Title Company |
|---|---|---|---|
| Tejada Carlos | $175,000 | -- | |
| Jaco Bros Investments Llc | $42,300 | -- | |
| Deutsche Bank National Trust C | $58,000 | -- | |
| Carroll Michael Will | -- | -- | |
| Evans Allen April | $73,900 | -- |
Source: Public Records
Mortgage History
| Date | Status | Borrower | Loan Amount |
|---|---|---|---|
| Open | Tejada Carlos | $178,062 | |
| Closed | Evans Allen April | $0 |
Source: Public Records
Tax History Compared to Growth
Tax History
| Year | Tax Paid | Tax Assessment Tax Assessment Total Assessment is a certain percentage of the fair market value that is determined by local assessors to be the total taxable value of land and additions on the property. | Land | Improvement |
|---|---|---|---|---|
| 2024 | $1,676 | $67,254 | $16,800 | $50,454 |
| 2023 | $1,666 | $67,254 | $16,800 | $50,454 |
| 2022 | $1,509 | $52,228 | $16,800 | $35,428 |
| 2021 | $1,091 | $35,427 | $10,000 | $25,427 |
| 2020 | $1,094 | $35,427 | $10,000 | $25,427 |
| 2019 | $1,044 | $33,152 | $10,000 | $23,152 |
| 2018 | $1,027 | $33,152 | $10,000 | $23,152 |
| 2017 | $856 | $29,408 | $10,000 | $19,408 |
| 2016 | $912 | $29,646 | $10,000 | $19,646 |
| 2015 | $923 | $29,883 | $10,000 | $19,883 |
| 2014 | $548 | $25,021 | $4,900 | $20,121 |
| 2013 | -- | $24,303 | $4,900 | $19,403 |
Source: Public Records
Map
Nearby Homes
- 758 Clarence Edwards Rd
- 575 Mackinaw Dr
- 236 Vision St
- 176 Market St
- 14 Smithwood Dr
- 190 Lokeys Ln
- 303 Ron Dr
- 209 Angie Way
- 755 Harry McCarty Rd
- 350 Punkin Junction Rd
- 0 Jb Owens Unit 7552902
- 0 Jb Owens Unit 7552891
- 0 Jb Owens Unit LOT 2 - 2.09 ACRES
- 0 Jb Owens Unit LOT 3 - 2.01 ACRES
- 1111 Otis Dr
- 220 Carl Bethlehem Rd SW
- 100 Rivington Dr
- 29 Kielder Dr
- 102 Rivington Dr
- 104 Rivington Dr
- 432 Carl Bethlehem Rd SW Unit 2
- 432 Carl Bethlehem Rd SW
- 418 Carl Bethlehem Rd SW
- 425 Carl Bethlehem Rd SW
- 436 Carl Bethlehem Rd SW Unit 1
- 422 Carl Bethlehem Rd SW
- 429 Carl Bethlehem Rd SW
- 414 Carl Bethlehem Rd SW
- 415 Carl Bethlehem Rd SW
- 410 Carl Bethlehem Rd SW
- 410 Carl Bethlehem Rd SW Unit 1
- 411 Carl Bethlehem Rd SW
- 445 Carl-Bethlehem Rd SW
- 445 Carl Bethlehem Rd SW Unit Rabun
- 445 Carl Bethlehem Rd SW Unit Burton
- 445 Carl Bethlehem Rd SW Unit Rabon
- 445 Carl Bethlehem Rd SW
- 450 Carl Bethlehem Rd SW
- 404 Carl Bethlehem Rd SW
- 399 Carl Bethlehem Rd SW