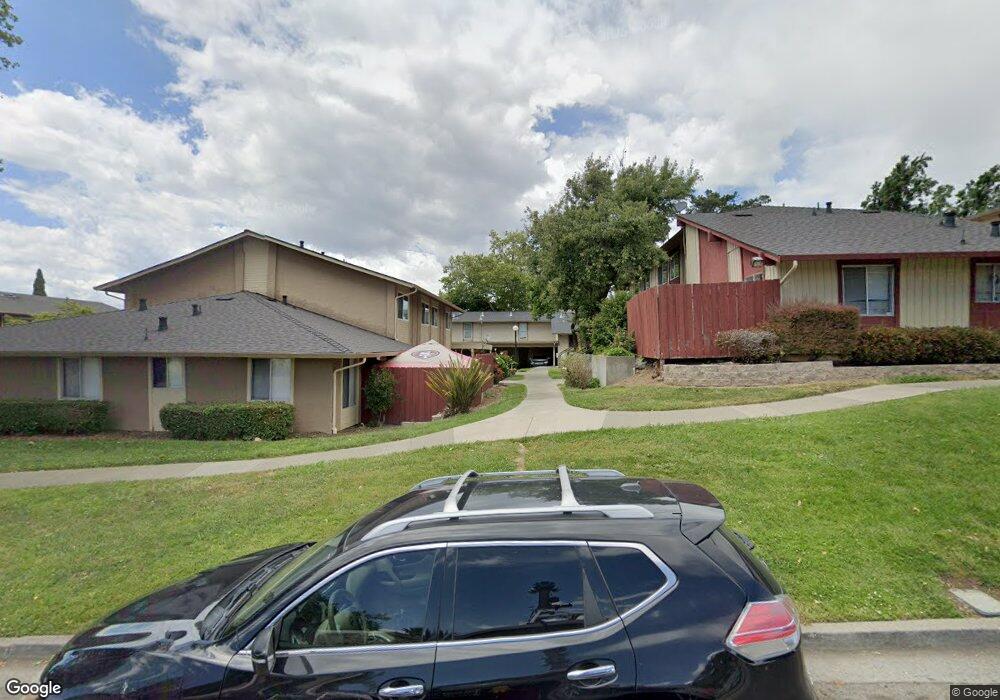
428 Corcoran Ave Vallejo, CA 94589
North Vallejo NeighborhoodEstimated Value: $213,000 - $256,255
3
Beds
2
Baths
1,032
Sq Ft
$220/Sq Ft
Est. Value
About This Home
This home is located at 428 Corcoran Ave, Vallejo, CA 94589 and is currently estimated at $227,064, approximately $220 per square foot. 428 Corcoran Ave is a home located in Solano County with nearby schools including Elsa Widenmann Elementary, Solano Middle School, and Vallejo High School.
Ownership History
Date
Name
Owned For
Owner Type
Purchase Details
Closed on
May 7, 2018
Sold by
Wallis Stephanie Ann and Wallis Pamela
Bought by
The Wallis Family Revocable Trust and Wallis Stephanie A
Current Estimated Value
Purchase Details
Closed on
Feb 4, 2014
Sold by
Wallis Stephanie Ann and Wallis Steven
Bought by
Wallis Stephanie Ann and Wallis Pamela
Purchase Details
Closed on
Nov 1, 2000
Sold by
Villanueva Ernest
Bought by
Wallis Steven and Wallis Pamela
Home Financials for this Owner
Home Financials are based on the most recent Mortgage that was taken out on this home.
Original Mortgage
$33,600
Outstanding Balance
$12,381
Interest Rate
7.88%
Estimated Equity
$214,683
Purchase Details
Closed on
Dec 1, 1997
Sold by
Villanueva Ernest and Villanueva Virginia A
Bought by
Villanueva Ernest L and Villanueva Virginia A
Create a Home Valuation Report for This Property
The Home Valuation Report is an in-depth analysis detailing your home's value as well as a comparison with similar homes in the area
Home Values in the Area
Average Home Value in this Area
Purchase History
| Date | Buyer | Sale Price | Title Company |
|---|---|---|---|
| The Wallis Family Revocable Trust | -- | None Available | |
| Wallis Stephanie Ann | -- | None Available | |
| Wallis Steven | $42,000 | Fidelity National Title Co | |
| Villanueva Ernest L | -- | -- |
Source: Public Records
Mortgage History
| Date | Status | Borrower | Loan Amount |
|---|---|---|---|
| Open | Wallis Steven | $33,600 |
Source: Public Records
Tax History
| Year | Tax Paid | Tax Assessment Tax Assessment Total Assessment is a certain percentage of the fair market value that is determined by local assessors to be the total taxable value of land and additions on the property. | Land | Improvement |
|---|---|---|---|---|
| 2025 | $1,806 | $63,275 | $22,596 | $40,679 |
| 2024 | $1,806 | $62,035 | $22,153 | $39,882 |
| 2023 | $1,654 | $60,819 | $21,719 | $39,100 |
| 2022 | $1,529 | $59,628 | $21,294 | $38,334 |
| 2021 | $1,492 | $58,460 | $20,877 | $37,583 |
| 2020 | $1,471 | $57,861 | $20,663 | $37,198 |
| 2019 | $1,398 | $56,727 | $20,258 | $36,469 |
| 2018 | $1,289 | $55,615 | $19,861 | $35,754 |
| 2017 | $1,204 | $54,525 | $19,472 | $35,053 |
| 2016 | $644 | $53,457 | $19,091 | $34,366 |
| 2015 | $636 | $52,655 | $18,805 | $33,850 |
| 2014 | $627 | $51,624 | $18,437 | $33,187 |
Source: Public Records
Map
Nearby Homes
- 102 Dartmouth Ave
- 203 Baylor Dr Unit 11
- 818 Falcon Dr
- 300 College Ave
- 810 Stanford Dr
- 106 Fieldstone Way
- 121 Forsythia Ct
- 135 Spencer St
- 136 Olympic Dr
- 475 Whitney Ave
- 408 Lakeside Dr
- 240 Rinaldo Dr
- 35 Marla Dr
- 121 Notre Dame Ct
- 316 Meadows Dr
- 1815 Mini Dr
- 147 Erin Dr
- 148 Obrien Cir
- 130 Kennison Ct
- 2555 Flosden Rd Unit 117
- 428 Corcoran Ave Unit 3
- 428 Corcoran Ave
- 428 Corcoran Ave Unit 2
- 428 Corcoran Ave
- 130 Amherst Ave
- 416 Corcoran Ave Unit 3
- 416 Corcoran Ave Unit 1
- 416 Corcoran Ave
- 416 Corcoran Ave
- 416 Corcoran Ave
- 416 Corcoran Ave
- 420 Corcoran Ave Unit 2
- 420 Corcoran Ave Unit 1
- 420 Corcoran Ave Unit 4
- 420 Corcoran Ave
- 420 Corcoran Ave
- 420 Corcoran Ave Unit 99
- 136 Amherst Ave
- 440 Corcoran Ave Unit 2
Your Personal Tour Guide
Ask me questions while you tour the home.