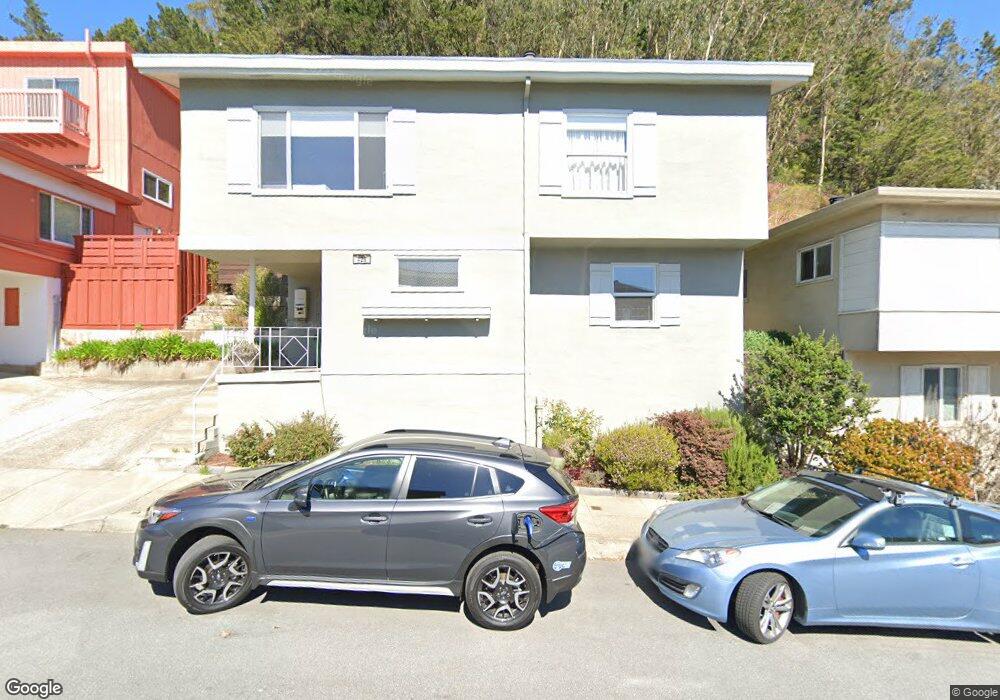
428 Dellbrook Ave San Francisco, CA 94131
Midtown Terrace NeighborhoodEstimated Value: $1,074,000 - $1,376,000
2
Beds
1
Bath
877
Sq Ft
$1,450/Sq Ft
Est. Value
About This Home
This home is located at 428 Dellbrook Ave, San Francisco, CA 94131 and is currently estimated at $1,271,655, approximately $1,450 per square foot. 428 Dellbrook Ave is a home located in San Francisco County with nearby schools including Clarendon Alternative Elementary School, Presidio Middle School, and St. Brendan Elementary School.
Ownership History
Date
Name
Owned For
Owner Type
Purchase Details
Closed on
Apr 10, 2024
Sold by
Gould-Wood Family Revocable Trust and Gould William R
Bought by
Nguyen Richard Long and Taylor Stephanie Megan
Current Estimated Value
Purchase Details
Closed on
Apr 8, 2021
Sold by
Gould William R
Bought by
Gould William R and Wood Russel J
Purchase Details
Closed on
Feb 10, 2021
Sold by
Gould William R
Bought by
Gould William R
Purchase Details
Closed on
Apr 8, 2020
Sold by
Gould William R and Martin Susan G
Bought by
Gould William R and Martin Susan G
Purchase Details
Closed on
Nov 1, 2010
Sold by
Lew William
Bought by
Gould William R and Gould William R
Purchase Details
Closed on
Feb 25, 1996
Sold by
Lew William
Bought by
Lew William
Create a Home Valuation Report for This Property
The Home Valuation Report is an in-depth analysis detailing your home's value as well as a comparison with similar homes in the area
Home Values in the Area
Average Home Value in this Area
Purchase History
| Date | Buyer | Sale Price | Title Company |
|---|---|---|---|
| Nguyen Richard Long | $1,130,000 | First American Title | |
| Gould William R | -- | None Available | |
| Gould William R | -- | None Available | |
| Gould William R | -- | None Available | |
| Gould William R | -- | None Available | |
| Gould William R | -- | None Available | |
| Gould William R | $520,000 | Fidelity National Title Co | |
| Lew William | -- | -- |
Source: Public Records
Tax History Compared to Growth
Tax History
| Year | Tax Paid | Tax Assessment Tax Assessment Total Assessment is a certain percentage of the fair market value that is determined by local assessors to be the total taxable value of land and additions on the property. | Land | Improvement |
|---|---|---|---|---|
| 2025 | $8,440 | $1,152,600 | $806,820 | $345,780 |
| 2024 | $8,440 | $653,136 | $457,198 | $195,938 |
| 2023 | $8,307 | $640,331 | $448,234 | $192,097 |
| 2022 | $8,139 | $627,777 | $439,446 | $188,331 |
| 2021 | $7,991 | $615,448 | $430,820 | $184,628 |
| 2020 | $8,040 | $609,140 | $426,404 | $182,736 |
| 2019 | $7,768 | $597,204 | $418,047 | $179,157 |
| 2018 | $7,426 | $585,496 | $409,851 | $175,645 |
| 2017 | $7,039 | $574,018 | $401,816 | $172,202 |
| 2016 | $6,906 | $562,765 | $393,938 | $168,827 |
| 2015 | $6,818 | $554,314 | $388,022 | $166,292 |
| 2014 | $6,638 | $543,458 | $380,422 | $163,036 |
Source: Public Records
Map
Nearby Homes
- 32 Forest Knolls Dr
- 202 Oak Park Dr
- 113 Warren Dr
- 150 Glenbrook Ave
- 77 Crestmont Dr
- 105 Skyview Way
- 75 Knollview Way
- 180 Palo Alto Ave
- 620 Clarendon Ave
- 1230 1240 Twin Peaks Blvd
- 172 Panorama Dr
- 224 Twin Peaks Blvd
- 327-329 Crestmont Dr
- 327 Crestmont Dr Unit 329
- 101 Graystone Terrace Unit 111
- 20 Parkridge Dr Unit 12
- 160 Gardenside Dr Unit 101
- 83 Panorama Dr
- 89 Glenview Dr
- 392 Corbett Ave
- 422 Dellbrook Ave
- 434 Dellbrook Ave
- 418 Dellbrook Ave
- 440 Dellbrook Ave
- 412 Dellbrook Ave
- 444 Dellbrook Ave
- 429 Dellbrook Ave
- 425 Dellbrook Ave
- 452 Dellbrook Ave
- 421 Dellbrook Ave
- 433 Dellbrook Ave
- 408 Dellbrook Ave
- 417 Dellbrook Ave
- 437 Dellbrook Ave
- 468 Dellbrook Ave
- 413 Dellbrook Ave
- 441 Dellbrook Ave
- 404 Dellbrook Ave
- 472 Dellbrook Ave
- 445 Dellbrook Ave