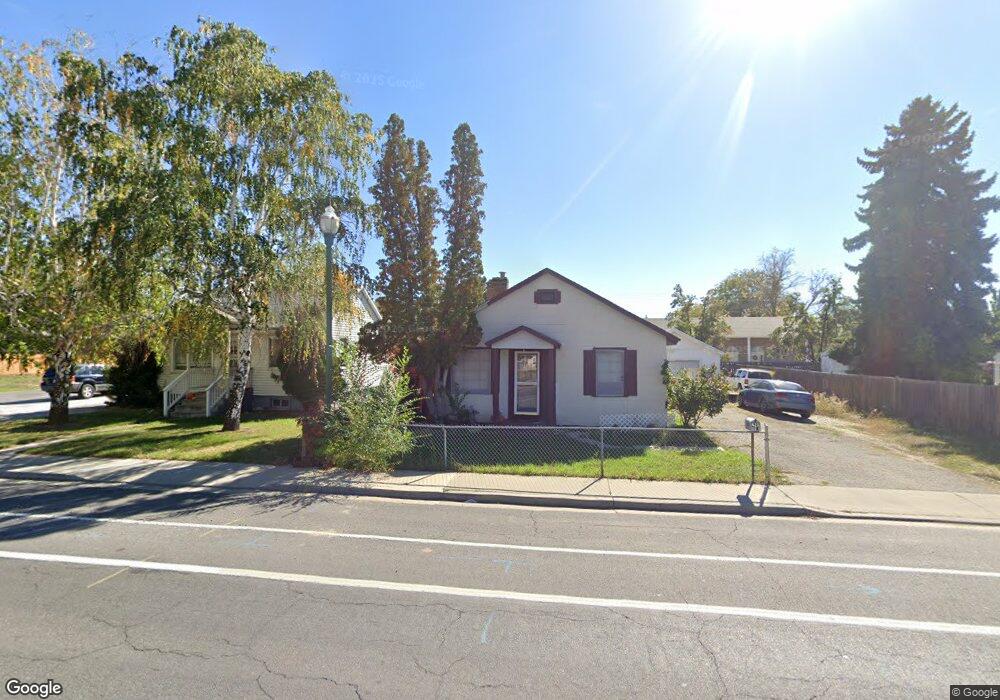
428 E 1600 S Orem, UT 84058
Cherry Hill NeighborhoodEstimated Value: $339,000 - $526,000
2
Beds
1
Bath
672
Sq Ft
$605/Sq Ft
Est. Value
About This Home
This home is located at 428 E 1600 S, Orem, UT 84058 and is currently estimated at $406,888, approximately $605 per square foot. 428 E 1600 S is a home located in Utah County with nearby schools including Cherry Hill Elementary School, Lakeridge Jr High School, and Mountain View High School.
Ownership History
Date
Name
Owned For
Owner Type
Purchase Details
Closed on
Jan 26, 2016
Sold by
Prewitt Carrie R and Rowland Family Trust
Bought by
Rowland Rick Dean
Current Estimated Value
Purchase Details
Closed on
Jan 26, 2015
Sold by
Prewitt Carrie R and Rowland Family Trust
Bought by
Rowland Kenneth Wade and Rowland Jordyn Lynn
Purchase Details
Closed on
Apr 16, 2007
Sold by
Rowland Roy Dean and Rowland Maxine
Bought by
Rowland Roy Dean and Rowland Maxine
Create a Home Valuation Report for This Property
The Home Valuation Report is an in-depth analysis detailing your home's value as well as a comparison with similar homes in the area
Home Values in the Area
Average Home Value in this Area
Purchase History
| Date | Buyer | Sale Price | Title Company |
|---|---|---|---|
| Rowland Rick Dean | -- | None Available | |
| Bingham Debbie R | -- | None Available | |
| Prewitt Carrie R | -- | None Available | |
| Rowland Rick Dean | -- | None Available | |
| Rowland Kenneth Wade | -- | None Available | |
| Rowland Roy Dean | -- | None Available |
Source: Public Records
Tax History
| Year | Tax Paid | Tax Assessment Tax Assessment Total Assessment is a certain percentage of the fair market value that is determined by local assessors to be the total taxable value of land and additions on the property. | Land | Improvement |
|---|---|---|---|---|
| 2025 | $1,374 | $184,580 | -- | -- |
| 2024 | $1,374 | $167,970 | $0 | $0 |
| 2023 | $1,253 | $164,670 | $0 | $0 |
| 2022 | $1,430 | $182,050 | $0 | $0 |
| 2021 | $1,218 | $234,800 | $124,800 | $110,000 |
| 2020 | $1,090 | $206,600 | $99,800 | $106,800 |
| 2019 | $938 | $184,900 | $86,500 | $98,400 |
| 2018 | $896 | $168,800 | $83,200 | $85,600 |
| 2017 | $832 | $83,930 | $0 | $0 |
| 2016 | $800 | $74,415 | $0 | $0 |
| 2015 | $830 | $73,040 | $0 | $0 |
| 2014 | $792 | $69,355 | $0 | $0 |
Source: Public Records
Map
Nearby Homes
Your Personal Tour Guide
Ask me questions while you tour the home.