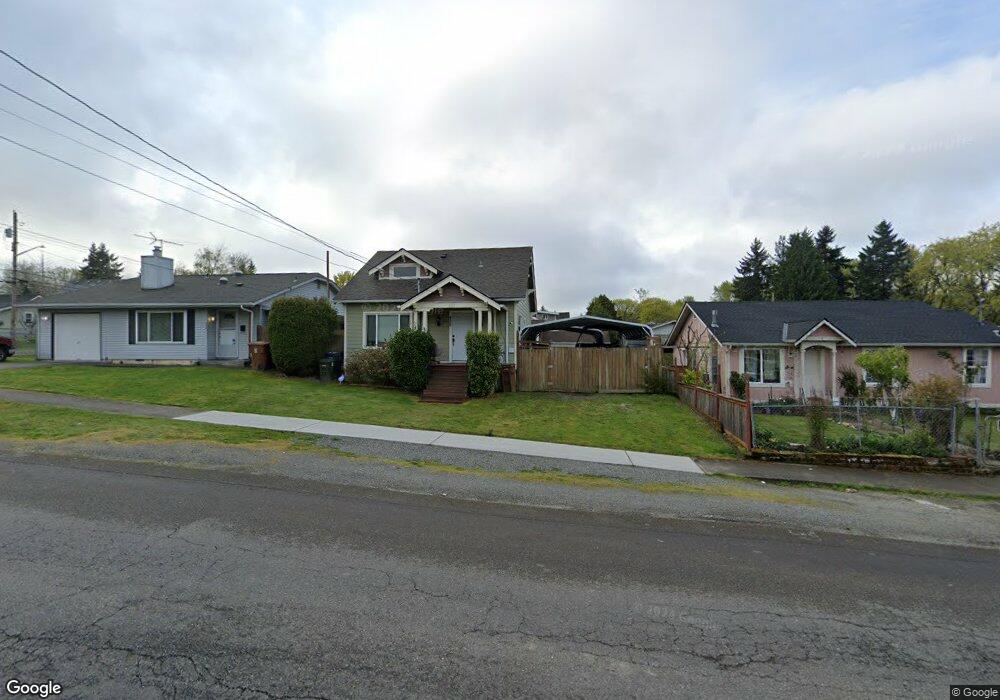
428 E 43rd St Tacoma, WA 98404
Eastside NeighborhoodEstimated Value: $408,000 - $468,000
3
Beds
1
Bath
1,098
Sq Ft
$394/Sq Ft
Est. Value
About This Home
This home is located at 428 E 43rd St, Tacoma, WA 98404 and is currently estimated at $432,373, approximately $393 per square foot. 428 E 43rd St is a home located in Pierce County with nearby schools including Lyon, Hunt Middle School, and Lincoln High School.
Ownership History
Date
Name
Owned For
Owner Type
Purchase Details
Closed on
May 14, 2010
Sold by
Fannie Mae
Bought by
Suderman Gary and Suderman Nadynne
Current Estimated Value
Home Financials for this Owner
Home Financials are based on the most recent Mortgage that was taken out on this home.
Original Mortgage
$95,450
Interest Rate
4.82%
Mortgage Type
FHA
Purchase Details
Closed on
Nov 9, 2009
Sold by
Sonnier Sean L
Bought by
Federal National Mortgage Association
Purchase Details
Closed on
Aug 21, 2006
Sold by
Gibson Sandra J
Bought by
Sonnier Sean L
Home Financials for this Owner
Home Financials are based on the most recent Mortgage that was taken out on this home.
Original Mortgage
$185,500
Interest Rate
8%
Mortgage Type
Purchase Money Mortgage
Purchase Details
Closed on
Dec 14, 1998
Sold by
Skinner Melvin Eugene
Bought by
Skinner Melvin Eugene and The Melvin Eugene Skinner Living Trust
Create a Home Valuation Report for This Property
The Home Valuation Report is an in-depth analysis detailing your home's value as well as a comparison with similar homes in the area
Home Values in the Area
Average Home Value in this Area
Purchase History
| Date | Buyer | Sale Price | Title Company |
|---|---|---|---|
| Suderman Gary | $87,400 | Chicago Title Insurance Co | |
| Federal National Mortgage Association | $166,211 | Accommodation | |
| Sonnier Sean L | $185,500 | Stewart Title | |
| Skinner Melvin Eugene | -- | -- |
Source: Public Records
Mortgage History
| Date | Status | Borrower | Loan Amount |
|---|---|---|---|
| Previous Owner | Suderman Gary | $95,450 | |
| Previous Owner | Sonnier Sean L | $185,500 |
Source: Public Records
Tax History
| Year | Tax Paid | Tax Assessment Tax Assessment Total Assessment is a certain percentage of the fair market value that is determined by local assessors to be the total taxable value of land and additions on the property. | Land | Improvement |
|---|---|---|---|---|
| 2025 | $3,953 | $387,700 | $177,800 | $209,900 |
| 2024 | $3,953 | $388,000 | $171,100 | $216,900 |
| 2023 | $3,953 | $354,800 | $159,400 | $195,400 |
| 2022 | $3,623 | $372,200 | $157,500 | $214,700 |
| 2021 | $3,323 | $264,100 | $98,400 | $165,700 |
| 2019 | $2,795 | $238,900 | $82,000 | $156,900 |
| 2018 | $2,837 | $214,800 | $65,600 | $149,200 |
| 2017 | $2,437 | $179,400 | $50,000 | $129,400 |
| 2016 | $2,156 | $130,000 | $37,300 | $92,700 |
| 2014 | $1,885 | $123,900 | $36,100 | $87,800 |
| 2013 | $1,885 | $109,500 | $31,700 | $77,800 |
Source: Public Records
Map
Nearby Homes
Your Personal Tour Guide
Ask me questions while you tour the home.