Estimated Value: $100,286 - $127,000
5
Beds
2
Baths
1,524
Sq Ft
$76/Sq Ft
Est. Value
About This Home
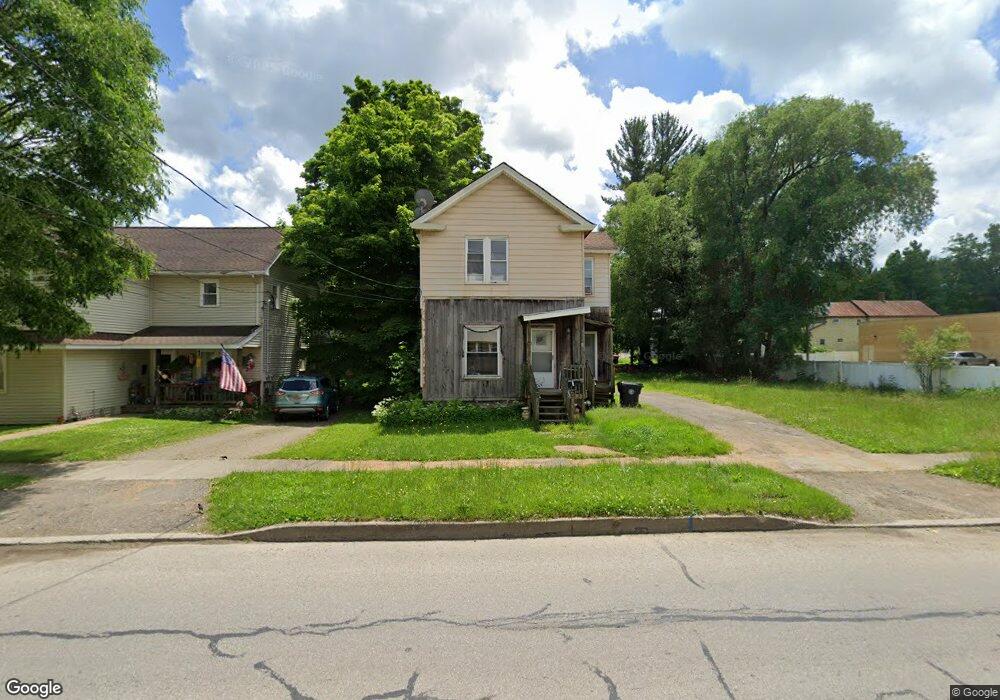
This home is located at 428 E Main St, Corry, PA 16407 and is currently estimated at $115,072, approximately $75 per square foot. 428 E Main St is a home located in Erie County with nearby schools including Corry Area Primary School, Corry Area Intermediate School, and Corry Area Middle School.
Ownership History
Date
Name
Owned For
Owner Type
Purchase Details
Closed on
Aug 12, 2014
Sold by
Ricci Estates Llc
Bought by
Cranston Shawn
Current Estimated Value
Purchase Details
Closed on
Sep 12, 2012
Sold by
Shelly David and Shelly Martha
Bought by
Ricci Estates Llc
Purchase Details
Closed on
Feb 27, 2012
Sold by
Erie County Tax Claim Bureau
Bought by
Shelly David and Shelly Martha
Purchase Details
Closed on
Apr 16, 2007
Sold by
Erie County Tax Claim Bureau and Craday Douglas G
Bought by
Gap Development
Create a Home Valuation Report for This Property
The Home Valuation Report is an in-depth analysis detailing your home's value as well as a comparison with similar homes in the area
Home Values in the Area
Average Home Value in this Area
Purchase History
| Date | Buyer | Sale Price | Title Company |
|---|---|---|---|
| Cranston Shawn | $5,000 | None Available | |
| Ricci Estates Llc | $13,000 | None Available | |
| Shelly David | $50,504 | None Available | |
| Gap Development | $50,504 | None Available |
Source: Public Records
Tax History
| Year | Tax Paid | Tax Assessment Tax Assessment Total Assessment is a certain percentage of the fair market value that is determined by local assessors to be the total taxable value of land and additions on the property. | Land | Improvement |
|---|---|---|---|---|
| 2025 | $1,508 | $46,100 | $6,100 | $40,000 |
| 2024 | $1,498 | $46,100 | $6,100 | $40,000 |
| 2023 | $1,461 | $46,100 | $6,100 | $40,000 |
| 2022 | $1,433 | $46,100 | $6,100 | $40,000 |
| 2021 | $1,423 | $46,100 | $6,100 | $40,000 |
| 2020 | $1,412 | $46,100 | $6,100 | $40,000 |
| 2019 | $1,389 | $46,100 | $6,100 | $40,000 |
| 2018 | $1,370 | $46,100 | $6,100 | $40,000 |
| 2017 | $1,347 | $46,100 | $6,100 | $40,000 |
| 2016 | $1,453 | $46,100 | $6,100 | $40,000 |
| 2015 | $1,441 | $46,100 | $6,100 | $40,000 |
| 2014 | $623 | $46,100 | $6,100 | $40,000 |
Source: Public Records
Map
Nearby Homes
- 425 E Pleasant St
- 533 E South St
- 433 E Pleasant St
- 219 Summer St
- 515 Catherine St
- 604 E South St Unit 2
- 46375 6th St
- 35 W Smith St
- 27 W Frederick St
- 110-118 W Smith and 307 Grace St
- 535 Wright St
- 820 Mead Ave
- 40 Marion St
- 503 W Washington St
- 538 Grand St
- 318 Worth St
- 1026 N Center St
- 671 E Columbus Ave
- 837 Us Highway 6
- 132 Random Rd
Your Personal Tour Guide
Ask me questions while you tour the home.