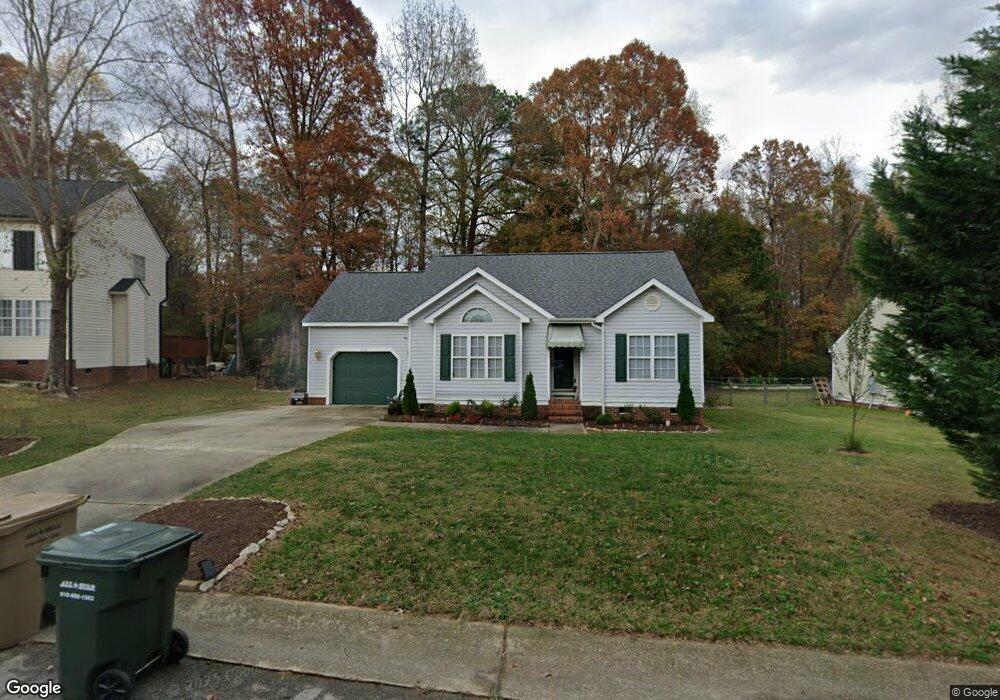
428 Hunter Way Clayton, NC 27520
Estimated Value: $278,000 - $292,000
3
Beds
2
Baths
1,274
Sq Ft
$225/Sq Ft
Est. Value
About This Home
This home is located at 428 Hunter Way, Clayton, NC 27520 and is currently estimated at $286,496, approximately $224 per square foot. 428 Hunter Way is a home located in Johnston County with nearby schools including West Clayton Elementary School, Clayton Middle School, and Clayton High.
Ownership History
Date
Name
Owned For
Owner Type
Purchase Details
Closed on
Sep 8, 2020
Sold by
Evans David Keith
Bought by
Evans Kimberly and Smith Kimberly
Current Estimated Value
Purchase Details
Closed on
Jun 18, 2014
Sold by
Pecora Thomas J and Pecora Lindsey
Bought by
Smith Kimberly
Home Financials for this Owner
Home Financials are based on the most recent Mortgage that was taken out on this home.
Original Mortgage
$114,950
Interest Rate
4.19%
Mortgage Type
New Conventional
Purchase Details
Closed on
Jan 5, 2006
Sold by
Dees William C and Denise Dees G
Bought by
Pecora Thomas J
Home Financials for this Owner
Home Financials are based on the most recent Mortgage that was taken out on this home.
Original Mortgage
$125,000
Interest Rate
6.18%
Mortgage Type
Fannie Mae Freddie Mac
Create a Home Valuation Report for This Property
The Home Valuation Report is an in-depth analysis detailing your home's value as well as a comparison with similar homes in the area
Home Values in the Area
Average Home Value in this Area
Purchase History
| Date | Buyer | Sale Price | Title Company |
|---|---|---|---|
| Evans Kimberly | -- | None Available | |
| Smith Kimberly | $121,000 | None Available | |
| Pecora Thomas J | $127,500 | None Available |
Source: Public Records
Mortgage History
| Date | Status | Borrower | Loan Amount |
|---|---|---|---|
| Previous Owner | Smith Kimberly | $114,950 | |
| Previous Owner | Pecora Thomas J | $125,000 |
Source: Public Records
Tax History
| Year | Tax Paid | Tax Assessment Tax Assessment Total Assessment is a certain percentage of the fair market value that is determined by local assessors to be the total taxable value of land and additions on the property. | Land | Improvement |
|---|---|---|---|---|
| 2025 | $2,951 | $292,130 | $80,000 | $212,130 |
| 2024 | $1,958 | $148,310 | $45,500 | $102,810 |
| 2023 | $1,913 | $148,310 | $45,500 | $102,810 |
| 2022 | $1,973 | $148,310 | $45,500 | $102,810 |
| 2021 | $1,943 | $148,310 | $45,500 | $102,810 |
| 2020 | $1,987 | $148,310 | $45,500 | $102,810 |
| 2019 | $1,987 | $148,310 | $45,500 | $102,810 |
| 2018 | $1,638 | $120,420 | $27,000 | $93,420 |
| 2017 | $1,602 | $120,420 | $27,000 | $93,420 |
| 2016 | $1,602 | $120,420 | $27,000 | $93,420 |
| 2015 | $1,571 | $120,420 | $27,000 | $93,420 |
| 2014 | $1,571 | $120,420 | $27,000 | $93,420 |
Source: Public Records
Map
Nearby Homes
- 468 Hunter Way
- 1137 Grovewood Dr
- 104 Bright Leaf Dr
- 1029 Cove Cir
- 257 Dairy Rd
- 201 Dairy Rd
- 37 W Cannalily Ln
- 2833 Bennington Dr
- 128 Glengariff Ln
- 33 Cheltenham Dr
- 212 Wexford Dr
- 214 Thumper Way
- 141 & 145 State Ave
- 603 Lakemont Dr
- 76 Douglas Fir Place
- 207 Sleepy Creek Dr
- 25 W Fire Opal Ct
- 216 Bentwood Ln
- 405 Winding Wood Dr
- 418 Averasboro Dr
- 432 Hunter Way
- 424 Hunter Way
- 420 Hunter Way
- 417 Hunter Way
- LOT 83 Hunter Way
- LOT85 Hunter Way
- LOT 107 Hunter Way
- 0 Hunter Way Unit 1862606
- 0 Hunter Way Unit 82 TR1862606
- 412 Hunter Way
- 413 Hunter Way
- 6 Cabin Branch Rd
- 409 Hunter Way
- 408 Hunter Way
- 7 Cabin Branch Rd
- 238 Lynn Dr
- 204 Lynn Dr
- 231 Lynn Dr
- 280 Lynn Dr
- 300 Lynn Dr
Your Personal Tour Guide
Ask me questions while you tour the home.