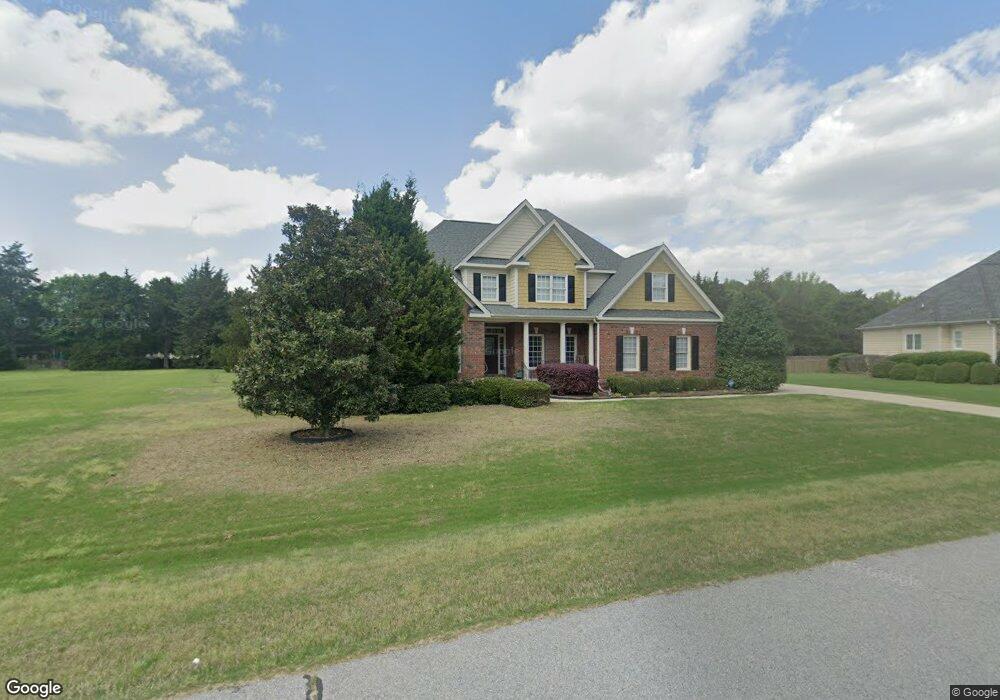
428 Kings Hollow Dr Unit Lot29 Raleigh, NC 27603
Estimated Value: $616,789 - $661,000
4
Beds
3
Baths
3,029
Sq Ft
$210/Sq Ft
Est. Value
About This Home
This home is located at 428 Kings Hollow Dr Unit Lot29, Raleigh, NC 27603 and is currently estimated at $637,197, approximately $210 per square foot. 428 Kings Hollow Dr Unit Lot29 is a home located in Wake County with nearby schools including Rand Road Elementary, North Garner Middle, and South Garner High.
Ownership History
Date
Name
Owned For
Owner Type
Purchase Details
Closed on
Sep 9, 2020
Sold by
Fordyce James W and Fordyce Mary T
Bought by
Kelley Robert Allen and Kelley Jacouelyn Rosalie
Current Estimated Value
Purchase Details
Closed on
Dec 30, 2009
Sold by
Williams Tyson M and Brett Williams Stephanie Marie
Bought by
Fordyce Ii James W and Tucking Mary T
Home Financials for this Owner
Home Financials are based on the most recent Mortgage that was taken out on this home.
Original Mortgage
$288,400
Interest Rate
4.82%
Mortgage Type
New Conventional
Purchase Details
Closed on
Feb 26, 2007
Sold by
Gottfried Homes Inc
Bought by
Williams Eugene Ward
Create a Home Valuation Report for This Property
The Home Valuation Report is an in-depth analysis detailing your home's value as well as a comparison with similar homes in the area
Home Values in the Area
Average Home Value in this Area
Purchase History
| Date | Buyer | Sale Price | Title Company |
|---|---|---|---|
| Kelley Robert Allen | $4,200 | None Available | |
| Robert Kelley And Jacquelyn Kelley Living Tru | $420,000 | None Listed On Document | |
| Fordyce Ii James W | $361,000 | None Available | |
| Williams Eugene Ward | $390,000 | None Available |
Source: Public Records
Mortgage History
| Date | Status | Borrower | Loan Amount |
|---|---|---|---|
| Previous Owner | Fordyce Ii James W | $288,400 |
Source: Public Records
Tax History Compared to Growth
Tax History
| Year | Tax Paid | Tax Assessment Tax Assessment Total Assessment is a certain percentage of the fair market value that is determined by local assessors to be the total taxable value of land and additions on the property. | Land | Improvement |
|---|---|---|---|---|
| 2025 | $3,626 | $563,753 | $110,000 | $453,753 |
| 2024 | $3,521 | $563,753 | $110,000 | $453,753 |
| 2023 | $3,234 | $412,227 | $56,000 | $356,227 |
| 2022 | $2,997 | $412,227 | $56,000 | $356,227 |
| 2021 | $2,917 | $412,227 | $56,000 | $356,227 |
| 2020 | $2,868 | $412,227 | $56,000 | $356,227 |
| 2019 | $2,967 | $360,883 | $65,000 | $295,883 |
| 2018 | $2,728 | $360,883 | $65,000 | $295,883 |
| 2017 | $2,586 | $360,883 | $65,000 | $295,883 |
| 2016 | $2,534 | $360,883 | $65,000 | $295,883 |
| 2015 | $2,941 | $420,618 | $68,000 | $352,618 |
| 2014 | -- | $420,618 | $68,000 | $352,618 |
Source: Public Records
Map
Nearby Homes
- 449 Kings Hollow Dr
- 1009 Feldmen Dr
- 5013 Contender Dr
- 1101 Robinfield Dr
- 1005 Turner Meadow Dr
- 2600 Banks Rd Unit Lot 2
- 2600 Banks Rd Unit Lot 1
- 2704 Stageline Dr
- 5512 Glenhurst North Dr
- 1220 Turner Woods Dr
- 2400 Trueway Ln
- 5216 Relay Way
- 10001 Joe Leach Rd
- 1017 Widgeon Way
- The Magnolia A Plan at Laneridge Estates
- The Beech B Plan at Laneridge Estates
- The Hickory II D Plan at Laneridge Estates
- The Crawford Plan at Laneridge Estates
- The Hickory II E Plan at Laneridge Estates
- The Crawford C Plan at Laneridge Estates
- 428 Kings Hollow Dr
- 424 Kings Hollow Dr
- 432 Kings Hollow Dr
- 505 Grand Prince Ln
- 425 Kings Hollow Dr
- 509 Grand Prince Ln
- 509 Grand Prince Ln Unit Lt 38
- 436 Kings Hollow Dr
- 420 Kings Hollow Dr
- 501 Grand Prince Ln
- 501 Grand Prince Ln Unit Lot36
- 433 Kings Hollow Dr
- 433 Kings Hollow Dr Unit Lot12
- 421 Kings Hollow Dr
- 440 Kings Hollow Dr
- 440 Kings Hollow Dr Unit Lot26
- 500 Grand Prince Ln
- 513 Grand Prince Ln
- 513 Grand Prince Ln Unit Lot39
- 413 Kings Hollow Dr