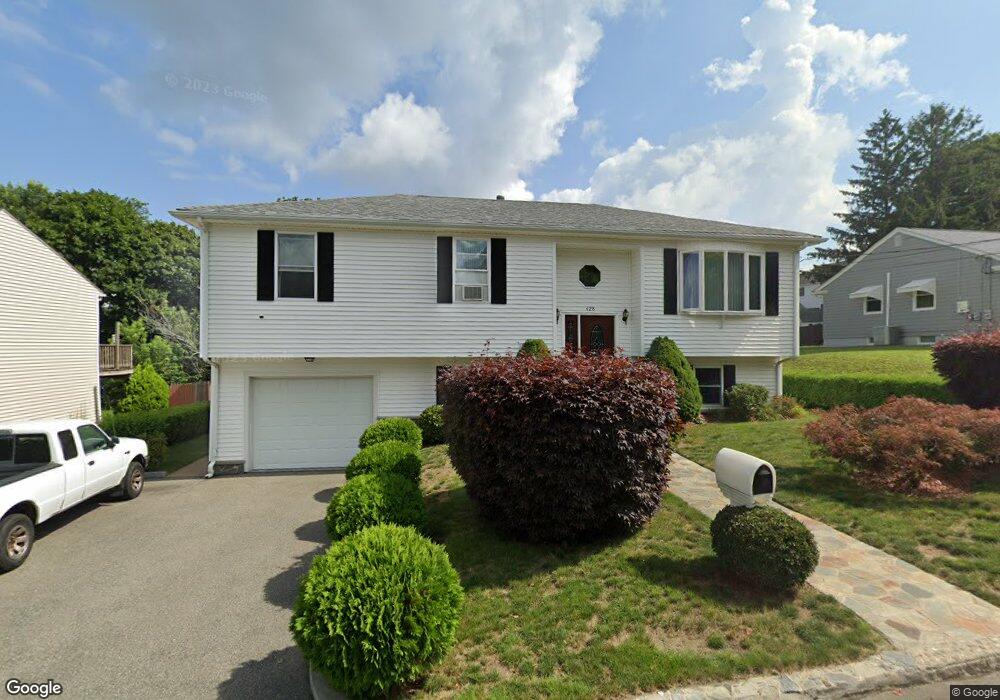
428 Ludlow St Fall River, MA 02721
Maplewood NeighborhoodEstimated Value: $485,000 - $529,000
3
Beds
2
Baths
1,998
Sq Ft
$254/Sq Ft
Est. Value
About This Home
This home is located at 428 Ludlow St, Fall River, MA 02721 and is currently estimated at $506,978, approximately $253 per square foot. 428 Ludlow St is a home located in Bristol County with nearby schools including Letourneau Elementary School, Matthew J. Kuss Middle School, and B M C Durfee High School.
Ownership History
Date
Name
Owned For
Owner Type
Purchase Details
Closed on
Nov 27, 2009
Sold by
Carvalho Manuel H and Carvalho Ana I
Bought by
Carvalho Manuel H and Carvalho Ana I
Current Estimated Value
Purchase Details
Closed on
Mar 13, 2000
Sold by
Cabral Timothy F
Bought by
Carvalho Maneul H and Carvalho Ana I
Home Financials for this Owner
Home Financials are based on the most recent Mortgage that was taken out on this home.
Original Mortgage
$70,000
Interest Rate
8.18%
Mortgage Type
Purchase Money Mortgage
Purchase Details
Closed on
Dec 7, 1999
Sold by
A & J Rlty Inc
Bought by
Cabral Timothy F
Home Financials for this Owner
Home Financials are based on the most recent Mortgage that was taken out on this home.
Original Mortgage
$183,000
Interest Rate
7.86%
Mortgage Type
Purchase Money Mortgage
Purchase Details
Closed on
Oct 15, 1999
Sold by
Roman Catholic Bishop
Bought by
A & J Realty Inc
Home Financials for this Owner
Home Financials are based on the most recent Mortgage that was taken out on this home.
Original Mortgage
$183,000
Interest Rate
7.86%
Mortgage Type
Purchase Money Mortgage
Create a Home Valuation Report for This Property
The Home Valuation Report is an in-depth analysis detailing your home's value as well as a comparison with similar homes in the area
Home Values in the Area
Average Home Value in this Area
Purchase History
| Date | Buyer | Sale Price | Title Company |
|---|---|---|---|
| Carvalho Manuel H | -- | -- | |
| Carvalho Maneul H | $133,000 | -- | |
| Cabral Timothy F | $223,000 | -- | |
| A & J Realty Inc | $170,000 | -- |
Source: Public Records
Mortgage History
| Date | Status | Borrower | Loan Amount |
|---|---|---|---|
| Previous Owner | A & J Realty Inc | $60,000 | |
| Previous Owner | A & J Realty Inc | $70,000 | |
| Previous Owner | A & J Realty Inc | $183,000 |
Source: Public Records
Tax History
| Year | Tax Paid | Tax Assessment Tax Assessment Total Assessment is a certain percentage of the fair market value that is determined by local assessors to be the total taxable value of land and additions on the property. | Land | Improvement |
|---|---|---|---|---|
| 2025 | $5,644 | $492,900 | $118,000 | $374,900 |
| 2024 | $5,041 | $438,700 | $115,700 | $323,000 |
| 2023 | $4,866 | $396,600 | $104,300 | $292,300 |
| 2022 | $4,252 | $336,900 | $98,400 | $238,500 |
| 2021 | $4,175 | $301,900 | $94,000 | $207,900 |
| 2020 | $3,526 | $244,000 | $89,700 | $154,300 |
| 2019 | $3,607 | $247,400 | $93,700 | $153,700 |
| 2018 | $3,482 | $238,200 | $94,400 | $143,800 |
| 2017 | $3,318 | $237,000 | $94,400 | $142,600 |
| 2016 | $3,135 | $230,000 | $97,300 | $132,700 |
| 2015 | $2,908 | $222,300 | $97,300 | $125,000 |
| 2014 | $2,797 | $222,300 | $97,300 | $125,000 |
Source: Public Records
Map
Nearby Homes
Your Personal Tour Guide
Ask me questions while you tour the home.