Estimated Value: $208,574
Studio
1
Bath
1,981
Sq Ft
$105/Sq Ft
Est. Value
About This Home
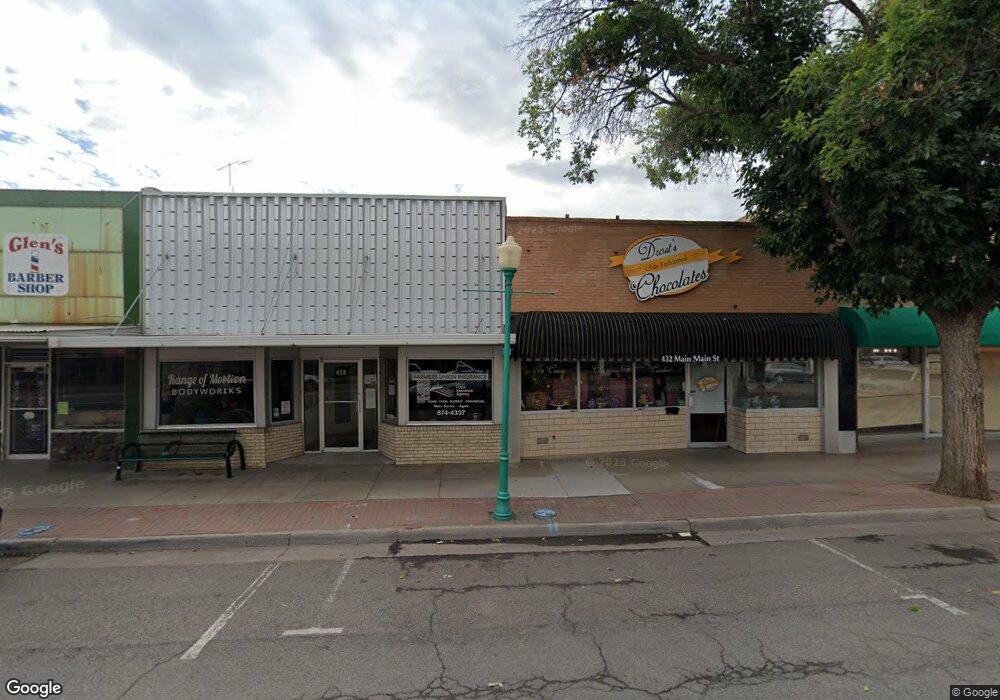
This home is located at 428 Main St, Delta, CO 81416 and is currently estimated at $208,574, approximately $105 per square foot. 428 Main St is a home located in Delta County with nearby schools including Garnet Mesa Elementary School, Lincoln Elementary School, and Delta Middle School.
Ownership History
Date
Name
Owned For
Owner Type
Purchase Details
Closed on
Jun 5, 2019
Sold by
Simmons Preston J
Bought by
Mautz Kirt and Mautz Deanna
Current Estimated Value
Home Financials for this Owner
Home Financials are based on the most recent Mortgage that was taken out on this home.
Original Mortgage
$100,000
Outstanding Balance
$77,183
Interest Rate
4.2%
Mortgage Type
Purchase Money Mortgage
Estimated Equity
$131,391
Purchase Details
Closed on
Jul 31, 2007
Sold by
Tallent Rebecca L and Tallent Lynn K
Bought by
Simmons Preston J
Home Financials for this Owner
Home Financials are based on the most recent Mortgage that was taken out on this home.
Original Mortgage
$145,000
Interest Rate
6.64%
Mortgage Type
Commercial
Create a Home Valuation Report for This Property
The Home Valuation Report is an in-depth analysis detailing your home's value as well as a comparison with similar homes in the area
Purchase History
| Date | Buyer | Sale Price | Title Company |
|---|---|---|---|
| Mautz Kirt | $151,050 | None Available | |
| Simmons Preston J | $145,000 | Fahtco |
Source: Public Records
Mortgage History
| Date | Status | Borrower | Loan Amount |
|---|---|---|---|
| Open | Mautz Kirt | $100,000 | |
| Previous Owner | Simmons Preston J | $145,000 |
Source: Public Records
Tax History
| Year | Tax Paid | Tax Assessment Tax Assessment Total Assessment is a certain percentage of the fair market value that is determined by local assessors to be the total taxable value of land and additions on the property. | Land | Improvement |
|---|---|---|---|---|
| 2024 | $2,293 | $34,646 | $8,370 | $26,276 |
| 2023 | $2,293 | $34,646 | $8,370 | $26,276 |
| 2022 | $2,839 | $43,989 | $8,700 | $35,289 |
| 2021 | $2,786 | $43,989 | $8,700 | $35,289 |
| 2020 | $2,498 | $38,872 | $11,020 | $27,852 |
| 2019 | $2,472 | $38,872 | $11,020 | $27,852 |
| 2018 | $2,356 | $35,709 | $5,510 | $30,199 |
| 2017 | $2,288 | $35,709 | $5,510 | $30,199 |
| 2016 | $2,175 | $37,167 | $5,510 | $31,657 |
| 2014 | -- | $35,705 | $6,090 | $29,615 |
Source: Public Records
Map
Nearby Homes
Your Personal Tour Guide
Ask me questions while you tour the home.