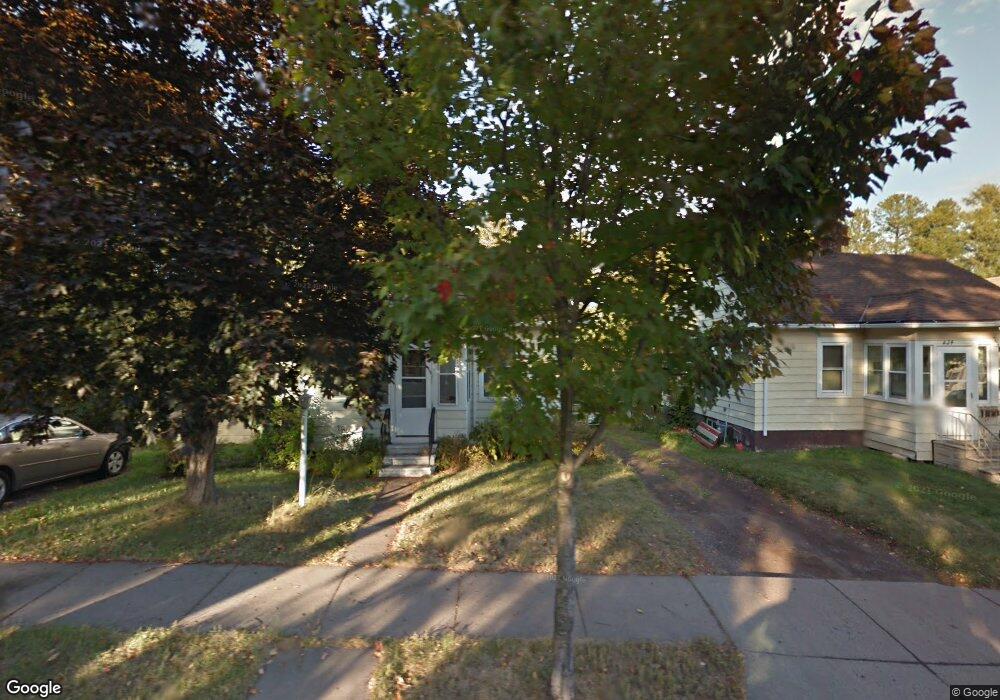
428 N 79th Ave W Unit Norton Park Duluth, MN 55807
Norton Park NeighborhoodEstimated Value: $186,000 - $207,000
2
Beds
1
Bath
936
Sq Ft
$209/Sq Ft
Est. Value
About This Home
This home is located at 428 N 79th Ave W Unit Norton Park, Duluth, MN 55807 and is currently estimated at $195,751, approximately $209 per square foot. 428 N 79th Ave W Unit Norton Park is a home located in St. Louis County with nearby schools including Stowe Elementary School, Lincoln Park Middle School, and Denfeld High School.
Ownership History
Date
Name
Owned For
Owner Type
Purchase Details
Closed on
Jul 10, 2008
Sold by
Deutsche Bank National Trust Co
Bought by
Anstett Christopher C
Current Estimated Value
Home Financials for this Owner
Home Financials are based on the most recent Mortgage that was taken out on this home.
Original Mortgage
$50,825
Interest Rate
6.42%
Mortgage Type
Purchase Money Mortgage
Purchase Details
Closed on
May 1, 2006
Sold by
Mickle Mary C and Mickle James E
Bought by
Mickle James E
Purchase Details
Closed on
Mar 23, 2005
Sold by
Mickle James E and Mickle Mary C
Bought by
Mickle James E and Mickle Mary C
Purchase Details
Closed on
Sep 25, 2003
Sold by
Mickle James E and Mickle Mary C
Bought by
Deutsche Bank National Trust Co
Create a Home Valuation Report for This Property
The Home Valuation Report is an in-depth analysis detailing your home's value as well as a comparison with similar homes in the area
Home Values in the Area
Average Home Value in this Area
Purchase History
| Date | Buyer | Sale Price | Title Company |
|---|---|---|---|
| Anstett Christopher C | $53,500 | First Fincl Title Agency Inc | |
| Mickle James E | -- | None Available | |
| Mickle James E | -- | -- | |
| Deutsche Bank National Trust Co | $132,877 | None Available |
Source: Public Records
Mortgage History
| Date | Status | Borrower | Loan Amount |
|---|---|---|---|
| Previous Owner | Anstett Christopher C | $50,825 |
Source: Public Records
Tax History Compared to Growth
Tax History
| Year | Tax Paid | Tax Assessment Tax Assessment Total Assessment is a certain percentage of the fair market value that is determined by local assessors to be the total taxable value of land and additions on the property. | Land | Improvement |
|---|---|---|---|---|
| 2024 | $1,706 | $152,400 | $25,800 | $126,600 |
| 2023 | $1,706 | $142,100 | $21,800 | $120,300 |
| 2022 | $1,718 | $139,800 | $29,200 | $110,600 |
| 2021 | $1,418 | $110,700 | $23,100 | $87,600 |
| 2020 | $1,354 | $110,700 | $23,100 | $87,600 |
| 2019 | $1,182 | $104,900 | $22,000 | $82,900 |
| 2018 | $1,132 | $95,700 | $22,000 | $73,700 |
| 2017 | $1,134 | $97,900 | $34,800 | $63,100 |
| 2016 | $1,112 | $82,400 | $8,200 | $74,200 |
| 2015 | $1,128 | $69,500 | $24,700 | $44,800 |
| 2014 | $1,128 | $69,500 | $24,700 | $44,800 |
Source: Public Records
Map
Nearby Homes
- 322 N 80th Ave W
- 519 N 81st Ave W
- 3xx N 83rd Ave W
- 523 S 72nd Ave W
- 8602 Maynard Place
- 8610 Maynard Place
- 121 Kayak View
- 8313 Eric Shaffer Way
- 8408 Potters Place
- 125 Goldys Way
- 3xx S 63rd Ave W
- 317 S 63rd Ave W
- 6514 Polk St
- xxxx Yellow Birch Trail
- 119 S 61st Ave W
- 10 Spruce Dr
- 63 S Elder Dr
- 310 S 58th Ave W
- 328 S 57th Ave W
- 10 N 59th Ave W
- 428 N 79th Ave W
- 424 N 79th Ave W
- 420 N 79th Ave W
- 423 N 79th Ave W
- 421 N 78th Ave W
- 429 N 78th Ave W
- 419 N 79th Ave W
- 416 N 79th Ave W
- 415 N 79th Ave W
- 431 N 79th Ave W
- 419 N 78th Ave W
- 433 N 78th Ave W
- 412 N 79th Ave W
- 435 N 79th Ave W
- 424 N 80th Ave W
- 428 N 80th Ave W
- 420 N 80th Ave W
- 430 N 80th Ave W
- 418 N 80th Ave W
- 408 N 79th Ave W