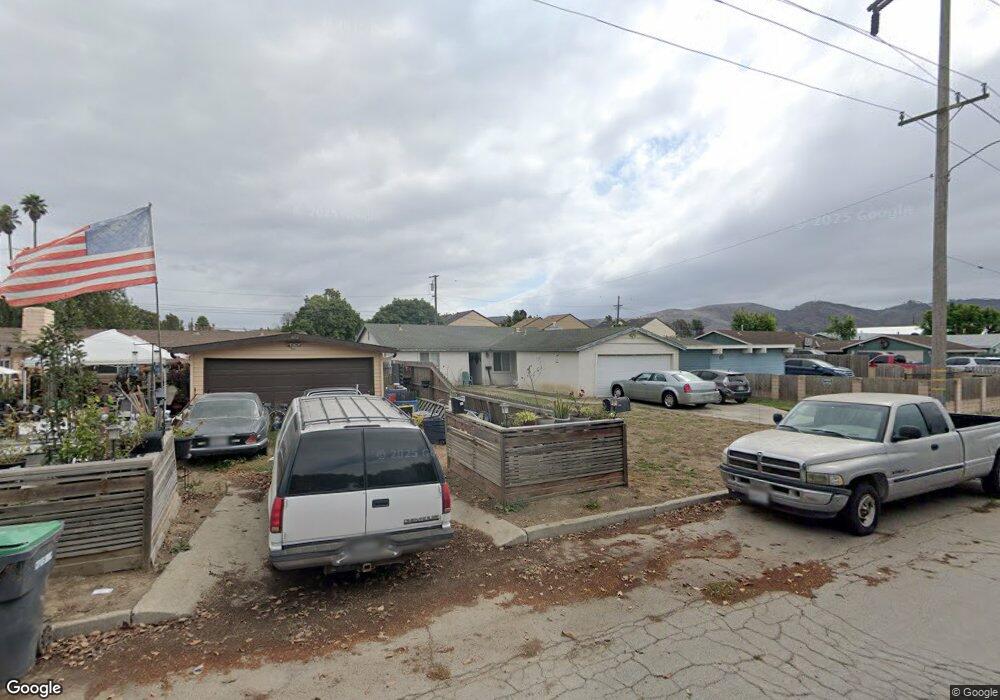
428 N E St Lompoc, CA 93436
Estimated Value: $498,000 - $570,000
3
Beds
2
Baths
1,260
Sq Ft
$423/Sq Ft
Est. Value
About This Home
This home is located at 428 N E St, Lompoc, CA 93436 and is currently estimated at $533,181, approximately $423 per square foot. 428 N E St is a home located in Santa Barbara County with nearby schools including Arthur Hapgood Elementary School, Lompoc Valley Middle School, and Lompoc High School.
Ownership History
Date
Name
Owned For
Owner Type
Purchase Details
Closed on
Jun 15, 2006
Sold by
Brooks Willie V
Bought by
Brooks Billy
Current Estimated Value
Purchase Details
Closed on
Nov 8, 2004
Sold by
Brooks Willie V and Brooks Willie Virginia
Bought by
Brooks Willie Virginia
Create a Home Valuation Report for This Property
The Home Valuation Report is an in-depth analysis detailing your home's value as well as a comparison with similar homes in the area
Home Values in the Area
Average Home Value in this Area
Purchase History
| Date | Buyer | Sale Price | Title Company |
|---|---|---|---|
| Brooks Billy | -- | None Available | |
| Brooks Willie Virginia | -- | -- |
Source: Public Records
Tax History
| Year | Tax Paid | Tax Assessment Tax Assessment Total Assessment is a certain percentage of the fair market value that is determined by local assessors to be the total taxable value of land and additions on the property. | Land | Improvement |
|---|---|---|---|---|
| 2025 | $669 | $57,266 | $15,712 | $41,554 |
| 2023 | $669 | $55,044 | $15,102 | $39,942 |
| 2022 | $656 | $53,965 | $14,806 | $39,159 |
| 2021 | $661 | $52,908 | $14,516 | $38,392 |
| 2020 | $654 | $52,367 | $14,368 | $37,999 |
| 2019 | $642 | $51,341 | $14,087 | $37,254 |
| 2018 | $632 | $50,335 | $13,811 | $36,524 |
| 2017 | $620 | $49,349 | $13,541 | $35,808 |
| 2016 | $609 | $48,382 | $13,276 | $35,106 |
| 2014 | $596 | $46,723 | $12,821 | $33,902 |
Source: Public Records
Map
Nearby Homes
- 533 N G St
- 622 N B St
- 510 N I St
- 610 E Pine Ave Unit 10
- 610 E Pine Ave Unit 29
- 610 E Pine Ave Unit 62
- 505 N 1st St
- 801, 851 California 246
- 321 N Third St
- 240 Quail Cir
- 701 E Pine Ave Unit 182
- 701 E Pine Ave Unit 176
- 701 E Pine Ave Unit 171
- 701 E Pine Ave Unit 161
- 526 N L St
- 117 S I St
- 205 S E St
- 215 S H St
- 109 S 3rd St
- 1204 E Walnut Ave Unit B
Your Personal Tour Guide
Ask me questions while you tour the home.