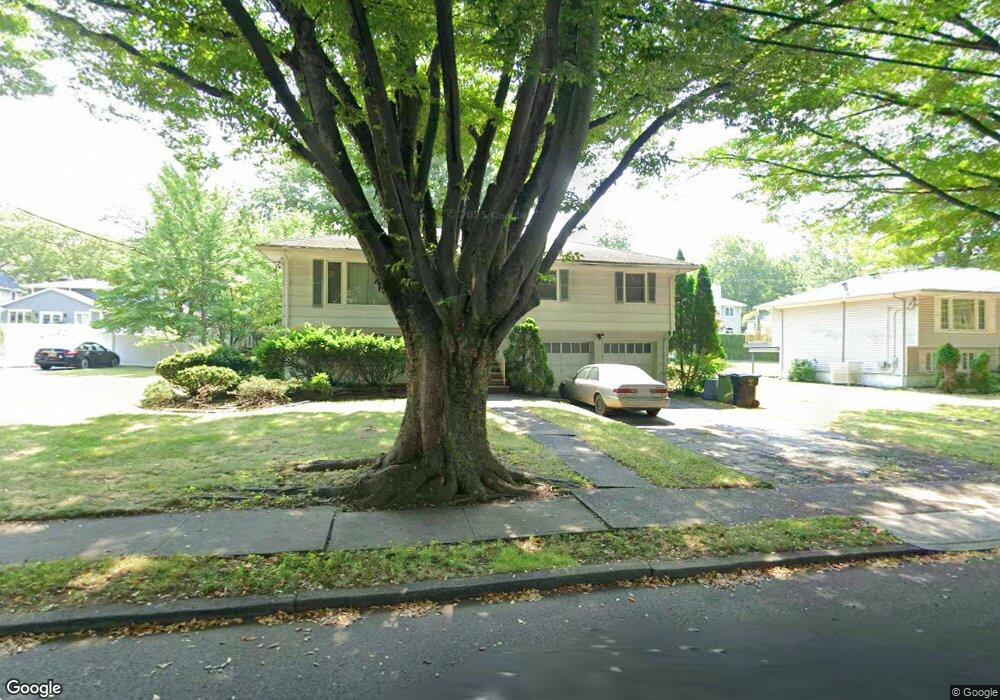
428 Yuhas Dr Paramus, NJ 07652
Estimated Value: $868,545 - $1,139,000
Studio
--
Bath
1,908
Sq Ft
$534/Sq Ft
Est. Value
About This Home
This home is located at 428 Yuhas Dr, Paramus, NJ 07652 and is currently estimated at $1,019,636, approximately $534 per square foot. 428 Yuhas Dr is a home located in Bergen County with nearby schools including Paramus High School and David Gregory School.
Ownership History
Date
Name
Owned For
Owner Type
Purchase Details
Closed on
Oct 23, 2008
Sold by
Chen Tsaulin and Chen Chia Hwei
Bought by
Chung Min Sun and Chuang Hsiao Lun
Current Estimated Value
Home Financials for this Owner
Home Financials are based on the most recent Mortgage that was taken out on this home.
Original Mortgage
$400,000
Outstanding Balance
$261,481
Interest Rate
6.08%
Mortgage Type
New Conventional
Estimated Equity
$758,155
Purchase Details
Closed on
Nov 1, 1996
Sold by
Kaprielian Raffi and Kaprielian Rita
Bought by
Chen Tsau Lin and Chen Chia Hwei
Home Financials for this Owner
Home Financials are based on the most recent Mortgage that was taken out on this home.
Original Mortgage
$127,000
Interest Rate
7.99%
Purchase Details
Closed on
Jul 22, 1994
Sold by
Schneider Gloria
Bought by
Kaprielian Raffi and Kaprielian Rita
Home Financials for this Owner
Home Financials are based on the most recent Mortgage that was taken out on this home.
Original Mortgage
$210,000
Interest Rate
8.25%
Create a Home Valuation Report for This Property
The Home Valuation Report is an in-depth analysis detailing your home's value as well as a comparison with similar homes in the area
Home Values in the Area
Average Home Value in this Area
Purchase History
| Date | Buyer | Sale Price | Title Company |
|---|---|---|---|
| Chung Min Sun | $606,000 | -- | |
| Chen Tsau Lin | $317,000 | -- | |
| Kaprielian Raffi | $280,000 | -- |
Source: Public Records
Mortgage History
| Date | Status | Borrower | Loan Amount |
|---|---|---|---|
| Open | Chung Min Sun | $400,000 | |
| Previous Owner | Chen Tsau Lin | $127,000 | |
| Previous Owner | Kaprielian Raffi | $210,000 |
Source: Public Records
Tax History Compared to Growth
Tax History
| Year | Tax Paid | Tax Assessment Tax Assessment Total Assessment is a certain percentage of the fair market value that is determined by local assessors to be the total taxable value of land and additions on the property. | Land | Improvement |
|---|---|---|---|---|
| 2025 | $10,291 | $727,200 | $473,500 | $253,700 |
| 2024 | $9,988 | $679,700 | $437,600 | $242,100 |
| 2023 | $9,480 | $651,100 | $417,100 | $234,000 |
| 2022 | $9,480 | $610,800 | $390,100 | $220,700 |
| 2021 | $8,976 | $542,700 | $339,200 | $203,500 |
| 2020 | $8,540 | $535,400 | $334,200 | $201,200 |
| 2019 | $8,298 | $447,100 | $302,500 | $144,600 |
| 2018 | $8,195 | $447,100 | $302,500 | $144,600 |
| 2017 | $8,052 | $447,100 | $302,500 | $144,600 |
| 2016 | $7,833 | $447,100 | $302,500 | $144,600 |
| 2015 | $7,753 | $447,100 | $302,500 | $144,600 |
| 2014 | $7,686 | $447,100 | $302,500 | $144,600 |
Source: Public Records
Map
Nearby Homes
- 375 Burnet Place
- 90 Arnot Place
- 366 Mckinley Blvd
- 216 E Midland Ave
- 23 Halco Dr
- 121 Circle Dr
- 311 N Farview Ave
- 362 Harrison St
- 308 Haywood Dr
- 298 Buttonwood Dr
- 517 Fordham Place
- 415 Bailey Rd
- 333 Harrison St
- 16 Columbine Rd
- 277 Columbia Terrace
- 366 Forest Ave
- 624 West Dr
- 156 Stuart St
- 390 Spring Valley Rd
- 322 E Midland Ave
- 432 Yuhas Dr
- 424 Yuhas Dr
- 429 Polly Ann Terrace
- 427 Polly Ann Terrace
- 427 Yuhas Dr
- 433 Polly Ann Terrace
- 423 Polly Ann Terrace
- 423 Yuhas Dr
- 438 Yuhas Dr
- 420 Yuhas Dr
- 437 Polly Ann Terrace
- 133 E Midland Ave
- 431 Yuhas Dr
- 437 Yuhas Dr
- 421 Yuhas Dr
- 439 Polly Ann Terrace
- 440 Yuhas Dr
- 434 Polly Ann Terrace
- 439 Yuhas Dr
- 139 E Midland Ave