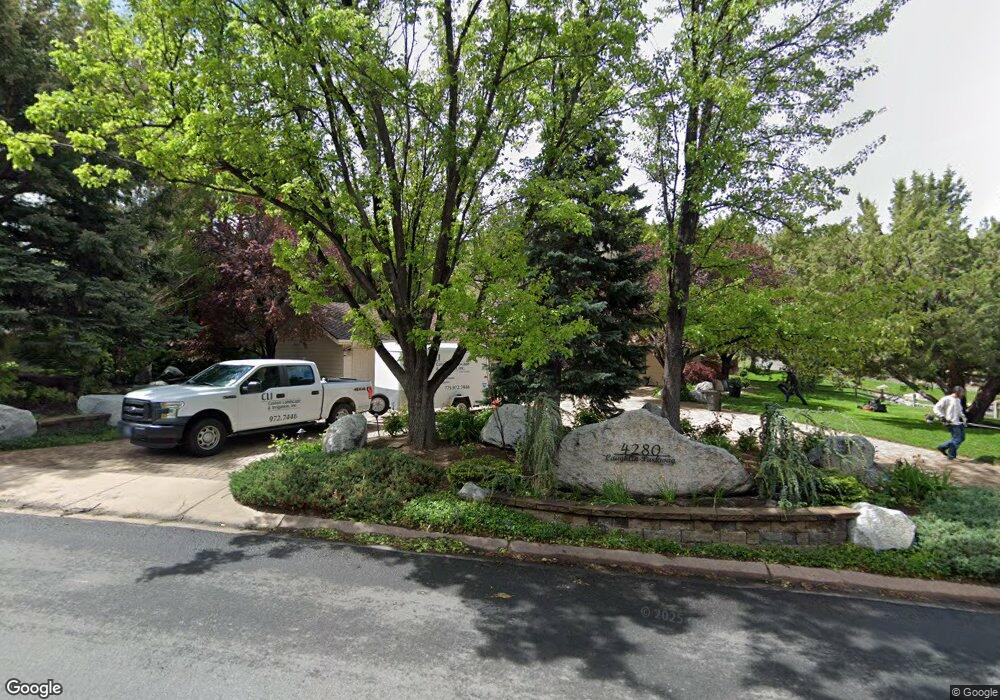
4280 Caughlin Pkwy Reno, NV 89519
Juniper Trails NeighborhoodEstimated Value: $1,266,908 - $1,774,000
5
Beds
4
Baths
3,462
Sq Ft
$431/Sq Ft
Est. Value
About This Home
This home is located at 4280 Caughlin Pkwy, Reno, NV 89519 and is currently estimated at $1,492,227, approximately $431 per square foot. 4280 Caughlin Pkwy is a home located in Washoe County with nearby schools including Roy Gomm Elementary School, Darrell C Swope Middle School, and Reno High School.
Ownership History
Date
Name
Owned For
Owner Type
Purchase Details
Closed on
Dec 8, 2016
Sold by
Line David Charles and Burnes Line Bernadette C
Bought by
Line David C and Burnes Line Bernadette C
Current Estimated Value
Purchase Details
Closed on
Oct 15, 2005
Sold by
Line David Charles
Bought by
Line David Charles and Burnes Line Bernadette C
Purchase Details
Closed on
Apr 17, 2003
Sold by
Line David Charles
Bought by
Line David Charles and The David Charles Line Living Trust
Purchase Details
Closed on
Feb 5, 1999
Sold by
Line Beverly J
Bought by
Line David C
Purchase Details
Closed on
Aug 3, 1994
Sold by
Muir G James and Muir Shirley V
Bought by
Muir Glenn James and Muir Shirley V
Create a Home Valuation Report for This Property
The Home Valuation Report is an in-depth analysis detailing your home's value as well as a comparison with similar homes in the area
Home Values in the Area
Average Home Value in this Area
Purchase History
| Date | Buyer | Sale Price | Title Company |
|---|---|---|---|
| Line David C | -- | None Available | |
| Line David Charles | -- | None Available | |
| Line David Charles | -- | -- | |
| Line David C | -- | -- | |
| Muir Glenn James | -- | -- |
Source: Public Records
Tax History Compared to Growth
Tax History
| Year | Tax Paid | Tax Assessment Tax Assessment Total Assessment is a certain percentage of the fair market value that is determined by local assessors to be the total taxable value of land and additions on the property. | Land | Improvement |
|---|---|---|---|---|
| 2025 | $5,646 | $236,497 | $104,738 | $131,759 |
| 2024 | $5,646 | $231,137 | $97,090 | $134,047 |
| 2023 | $5,484 | $220,487 | $94,763 | $125,725 |
| 2022 | $5,329 | $193,874 | $88,113 | $105,761 |
| 2021 | $5,171 | $175,773 | $69,825 | $105,948 |
| 2020 | $5,023 | $176,885 | $69,825 | $107,060 |
| 2019 | $4,870 | $175,153 | $69,825 | $105,328 |
| 2018 | $4,730 | $168,686 | $64,838 | $103,848 |
| 2017 | $4,590 | $162,921 | $58,188 | $104,733 |
| 2016 | $4,479 | $157,469 | $49,875 | $107,594 |
| 2015 | $4,473 | $146,960 | $37,406 | $109,554 |
| 2014 | $4,343 | $133,408 | $26,600 | $106,808 |
| 2013 | -- | $132,039 | $26,600 | $105,439 |
Source: Public Records
Map
Nearby Homes
- 4292 Caughlin Pkwy
- 4283 Water Hole Rd
- 60 Promontory Pointe
- 4120 Flintlock Cir
- 4229 Christy Way
- 4315 Water Hole Rd
- 4840 Keshmiri Place
- 1860 Hunter Creek Rd
- 30 Francovich Ct
- 3911 N Westpoint Dr
- 1720 Hunter Creek Rd Unit 5
- 1005 Stag Ridge Ct Unit 5
- 3332 Deer Ridge Ct
- 1570 Caughlin Creek Rd
- 4265 Hackamore Dr
- 4940 Turning Leaf Way Unit 3
- 3790 Ranch Crest Dr
- 5045 Hunters Peak Rd Unit 13
- 3678 Brighton Way
- 1074 Waverly Dr
- 4273 Bitteroot Rd
- 4275 Bitteroot Rd
- 4286 Caughlin Pkwy
- 4275 Caughlin Pkwy
- 3950 Plateau Rd
- 4277 Bitteroot Rd
- 4284 Caughlin Pkwy
- 4288 Caughlin Pkwy
- 4274 Bitteroot Rd
- 4273 Grubstake Cir
- 4281 Bitteroot Rd
- 3960 Plateau Rd
- 4269 Grubstake Cir
- 3975 Plateau Rd
- 4278 Bitteroot Rd
- 4272 Caughlin Pkwy Unit 4
- 20 Scattergun Cir
- 4285 Caughlin Pkwy
- 4288 Bitteroot Rd
- 40 Scattergun Cir