Estimated Value: $541,000 - $621,000
3
Beds
2
Baths
1,416
Sq Ft
$422/Sq Ft
Est. Value
About This Home
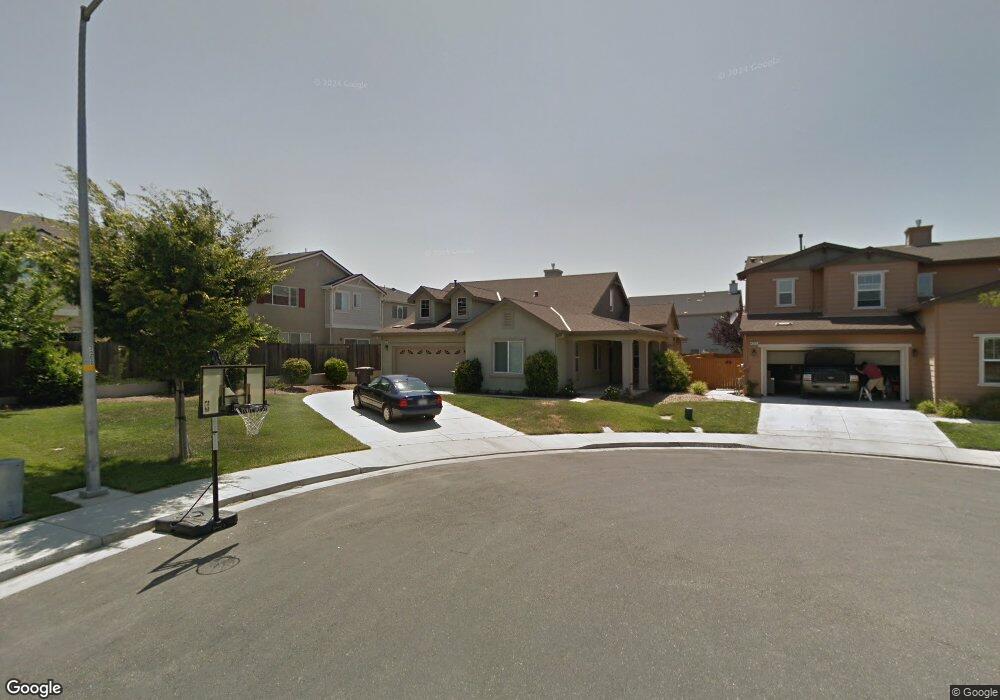
This home is located at 4281 Dally Ct, Tracy, CA 95377 and is currently estimated at $598,174, approximately $422 per square foot. 4281 Dally Ct is a home located in San Joaquin County with nearby schools including Anthony C. Traina Elementary School, John C. Kimball High School, and Montessori Elementary & Middle School of Tracy.
Ownership History
Date
Name
Owned For
Owner Type
Purchase Details
Closed on
May 28, 2010
Sold by
The Bank Of New York
Bought by
Akeley Linda Susan
Current Estimated Value
Home Financials for this Owner
Home Financials are based on the most recent Mortgage that was taken out on this home.
Original Mortgage
$174,552
Outstanding Balance
$116,640
Interest Rate
4.91%
Mortgage Type
New Conventional
Estimated Equity
$481,534
Purchase Details
Closed on
Aug 10, 2005
Sold by
Ryland Homes Of California Inc
Bought by
Pop Horatiu
Home Financials for this Owner
Home Financials are based on the most recent Mortgage that was taken out on this home.
Original Mortgage
$93,650
Interest Rate
5.48%
Mortgage Type
Credit Line Revolving
Purchase Details
Closed on
Apr 12, 2005
Sold by
Danila Iulia
Bought by
Pop Haratiu
Home Financials for this Owner
Home Financials are based on the most recent Mortgage that was taken out on this home.
Original Mortgage
$374,750
Interest Rate
6.37%
Mortgage Type
New Conventional
Create a Home Valuation Report for This Property
The Home Valuation Report is an in-depth analysis detailing your home's value as well as a comparison with similar homes in the area
Home Values in the Area
Average Home Value in this Area
Purchase History
| Date | Buyer | Sale Price | Title Company |
|---|---|---|---|
| Akeley Linda Susan | $218,500 | North American Title Company | |
| Pop Horatiu | $468,500 | First Amer Title Co | |
| Pop Haratiu | -- | First Amer Title Co |
Source: Public Records
Mortgage History
| Date | Status | Borrower | Loan Amount |
|---|---|---|---|
| Open | Akeley Linda Susan | $174,552 | |
| Previous Owner | Pop Horatiu | $93,650 | |
| Previous Owner | Pop Haratiu | $374,750 |
Source: Public Records
Tax History
| Year | Tax Paid | Tax Assessment Tax Assessment Total Assessment is a certain percentage of the fair market value that is determined by local assessors to be the total taxable value of land and additions on the property. | Land | Improvement |
|---|---|---|---|---|
| 2025 | $4,228 | $281,628 | $69,698 | $211,930 |
| 2024 | $4,101 | $276,107 | $68,332 | $207,775 |
| 2023 | $4,020 | $270,694 | $66,993 | $203,701 |
| 2022 | $4,195 | $265,387 | $65,680 | $199,707 |
| 2021 | $4,112 | $260,185 | $64,393 | $195,792 |
| 2020 | $4,065 | $257,518 | $63,733 | $193,785 |
| 2019 | $3,989 | $252,470 | $62,484 | $189,986 |
| 2018 | $3,909 | $247,520 | $61,259 | $186,261 |
| 2017 | $3,820 | $242,667 | $60,058 | $182,609 |
| 2016 | $3,753 | $237,910 | $58,881 | $179,029 |
| 2014 | $3,655 | $229,750 | $56,861 | $172,889 |
Source: Public Records
Map
Nearby Homes
- 1914 Remembrance Ln
- 4125 Keepsake Ct
- 1531 Riverview Ave
- 3339 Boca Way
- 1726 White Rock Dr
- 3311 Boca Way
- 3312 Boca Way
- 1382 Windsong Dr
- 4723 Avalon St
- 3286 Boca Way
- 3284 Boca Way
- 3255 Boca Way
- 3228 Boca Way
- 3343 Echo Way
- 3200 Boca Way
- 3368 Echo Way
- 3172 Boca Way
- 2373 Omega Ct
- 2305 Augusta Ave
- 3144 Boca Way
- 1845 Calaveras Ln
- 1855 Calaveras Ln
- 1835 Calaveras Ln
- 4261 Dally Ct
- 4202 Memoir Ave
- 4222 Memoir Ave
- 4192 Memoir Ave
- 1825 Calaveras Ln
- 4242 Memoir Ave
- 4290 Dally Ct
- 4182 Memoir Ave
- 4241 Dally Ct
- 1815 Calaveras Ln
- 4260 Dally Ct
- 4172 Memoir Ave Unit Tracy
- 4172 Memoir Ave
- 1846 Calaveras Ln
- 4230 Dally Ct
- 1836 Calaveras Ln
- 4221 Dally Ct
Your Personal Tour Guide
Ask me questions while you tour the home.