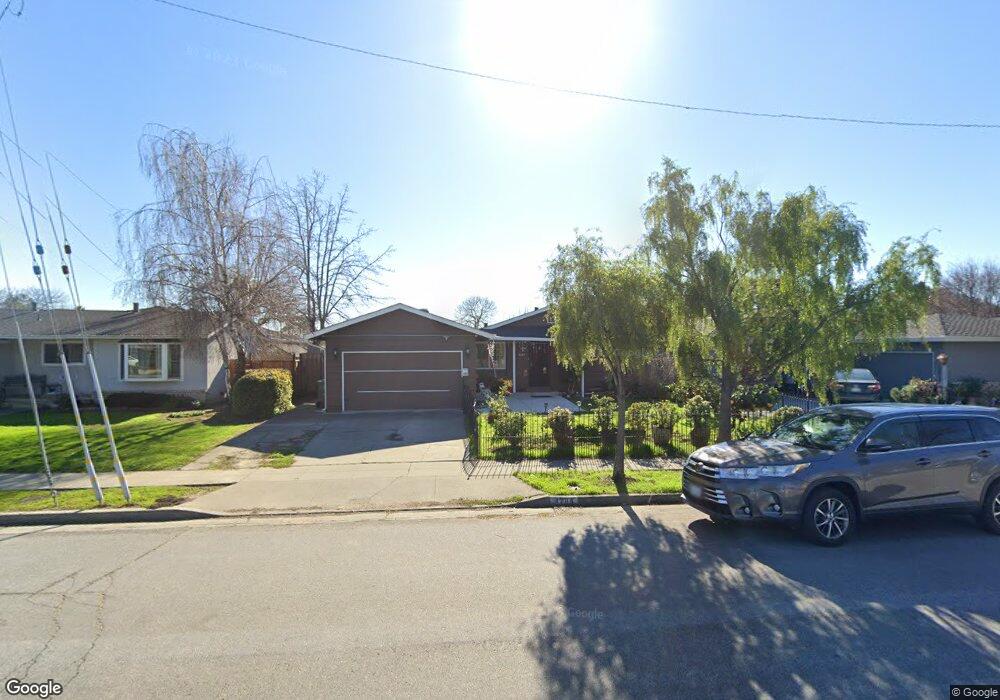
4284 Stanley Ave Fremont, CA 94538
Irvington NeighborhoodEstimated Value: $1,505,455 - $1,598,000
3
Beds
2
Baths
1,118
Sq Ft
$1,390/Sq Ft
Est. Value
About This Home
This home is located at 4284 Stanley Ave, Fremont, CA 94538 and is currently estimated at $1,553,614, approximately $1,389 per square foot. 4284 Stanley Ave is a home located in Alameda County with nearby schools including O. N. Hirsch Elementary School, John M. Horner Junior High School, and Irvington High School.
Ownership History
Date
Name
Owned For
Owner Type
Purchase Details
Closed on
Dec 12, 2012
Sold by
Lau Pius C and Lau Cherie R
Bought by
Lau Pius C and Lau Cherie R
Current Estimated Value
Home Financials for this Owner
Home Financials are based on the most recent Mortgage that was taken out on this home.
Original Mortgage
$365,000
Outstanding Balance
$252,885
Interest Rate
3.37%
Mortgage Type
New Conventional
Estimated Equity
$1,300,729
Purchase Details
Closed on
Aug 8, 2000
Sold by
Ashley Eugene and Ashley Celine N
Bought by
Lau Pius and Lau Cherie
Home Financials for this Owner
Home Financials are based on the most recent Mortgage that was taken out on this home.
Original Mortgage
$250,000
Interest Rate
8.25%
Purchase Details
Closed on
Oct 30, 1995
Sold by
Odonnell Barrie Fay and Odonnell James Joseph
Bought by
Ashley Eugene and Ashley Celine N
Home Financials for this Owner
Home Financials are based on the most recent Mortgage that was taken out on this home.
Original Mortgage
$155,420
Interest Rate
7.58%
Mortgage Type
FHA
Create a Home Valuation Report for This Property
The Home Valuation Report is an in-depth analysis detailing your home's value as well as a comparison with similar homes in the area
Home Values in the Area
Average Home Value in this Area
Purchase History
| Date | Buyer | Sale Price | Title Company |
|---|---|---|---|
| Lau Pius C | -- | Fidelity National Title Co | |
| Lau Pius | $350,000 | New Century Title Company | |
| Ashley Eugene | $169,000 | Old Republic Title Company | |
| Odonnell Hugh William | -- | Old Republic Title Company |
Source: Public Records
Mortgage History
| Date | Status | Borrower | Loan Amount |
|---|---|---|---|
| Open | Lau Pius C | $365,000 | |
| Closed | Lau Pius | $250,000 | |
| Previous Owner | Ashley Eugene | $155,420 |
Source: Public Records
Tax History
| Year | Tax Paid | Tax Assessment Tax Assessment Total Assessment is a certain percentage of the fair market value that is determined by local assessors to be the total taxable value of land and additions on the property. | Land | Improvement |
|---|---|---|---|---|
| 2025 | $6,604 | $520,354 | $158,206 | $369,148 |
| 2024 | $6,604 | $510,015 | $155,104 | $361,911 |
| 2023 | $6,418 | $506,880 | $152,064 | $354,816 |
| 2022 | $6,322 | $489,943 | $149,083 | $347,860 |
| 2021 | $6,169 | $480,200 | $146,160 | $341,040 |
| 2020 | $6,146 | $482,204 | $144,661 | $337,543 |
| 2019 | $6,077 | $472,751 | $141,825 | $330,926 |
| 2018 | $5,956 | $463,483 | $139,045 | $324,438 |
| 2017 | $5,807 | $454,397 | $136,319 | $318,078 |
| 2016 | $5,701 | $445,490 | $133,647 | $311,843 |
| 2015 | $5,619 | $438,801 | $131,640 | $307,161 |
| 2014 | $5,517 | $430,208 | $129,062 | $301,146 |
Source: Public Records
Map
Nearby Homes
- 41868 Gifford St
- 4309 Bora Ave
- 4533 Capewood Terrace
- 4537 Capewood Terrace
- 42663 Hamilton Way
- 41287 Mahoney St
- 4685 Victoria Park Ct
- 4759 Valpey Park Ave
- 4572 Theresa Ave
- 42552 Roberts Ave
- 3950 Paul Terrace Unit 5
- 4422 Hardwood St
- 3800 Adams Ave
- 41212 Fremont Blvd
- 41330 Roberts Ave
- 4612 Drury Ct
- 3614 Kay Ct
- 4470 Bush Cir
- 43252 Lindenwood St
- 42817 Fontainebleau Park Ln
- 4296 Stanley Ave
- 4272 Stanley Ave
- 4306 Stanley Ave
- 4264 Stanley Ave
- 41862 Maywood St
- 4318 Stanley Ave
- 41883 Gifford St
- 4258 Stanley Ave
- 41848 Maywood St
- 4330 Stanley Ave
- 41869 Gifford St
- 41861 Maywood St
- 42115 Edgewood St
- 4250 Stanley Ave
- 4297 Chetwood Ave
- 41834 Maywood St
- 4342 Stanley Ave
- 41855 Gifford St
- 41847 Maywood St
- 4285 Chetwood Ave
Your Personal Tour Guide
Ask me questions while you tour the home.