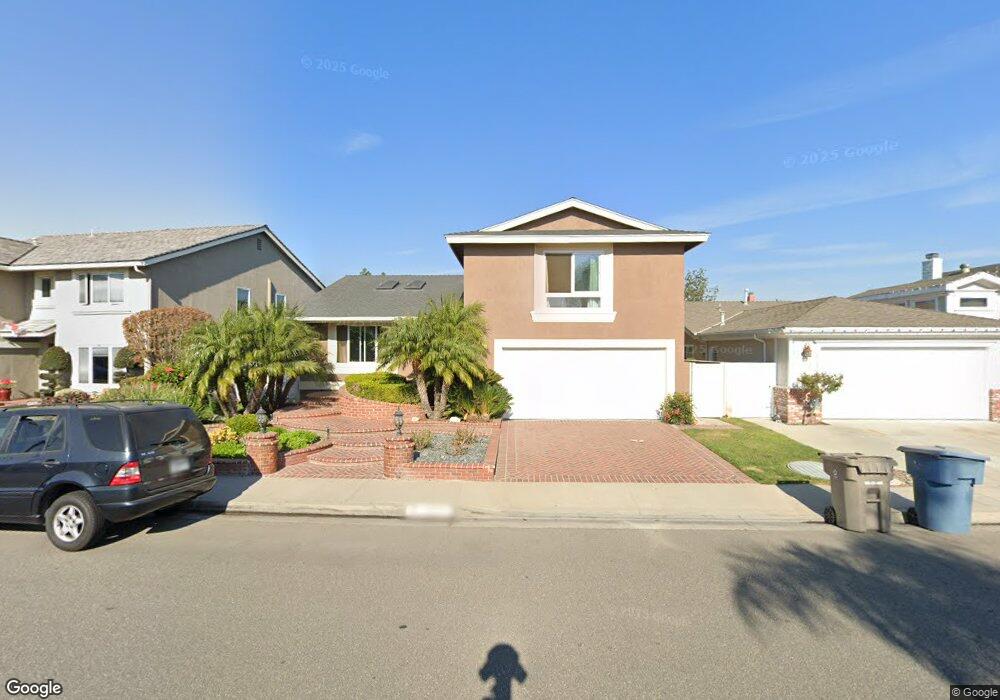
4289 Fir Ave Seal Beach, CA 90740
Estimated Value: $1,382,000 - $1,575,000
3
Beds
3
Baths
2,280
Sq Ft
$652/Sq Ft
Est. Value
About This Home
This home is located at 4289 Fir Ave, Seal Beach, CA 90740 and is currently estimated at $1,486,216, approximately $651 per square foot. 4289 Fir Ave is a home located in Orange County with nearby schools including Jack L. Weaver Elementary School, J. H. Mcgaugh Elementary School, and Sharon Christa Mcauliffe Middle School.
Ownership History
Date
Name
Owned For
Owner Type
Purchase Details
Closed on
Dec 21, 2007
Sold by
Deutsche Bank National Trust Co
Bought by
Weil Robert L and Weil Kathleen A
Current Estimated Value
Purchase Details
Closed on
Sep 17, 2007
Sold by
Ybarra Michael R
Bought by
Deutsche Bank National Trust Co and Long Beach Mortgage Loan Trust 2006-Wl3
Purchase Details
Closed on
Aug 5, 2005
Sold by
Alban Rhoda Gertrude
Bought by
Ybarra Michael R
Home Financials for this Owner
Home Financials are based on the most recent Mortgage that was taken out on this home.
Original Mortgage
$668,000
Interest Rate
6.7%
Mortgage Type
Purchase Money Mortgage
Purchase Details
Closed on
Feb 6, 1996
Sold by
Alban Rhoda Gertrude and Slatoff Rhoda
Bought by
Alban Rhoda Gertrude
Create a Home Valuation Report for This Property
The Home Valuation Report is an in-depth analysis detailing your home's value as well as a comparison with similar homes in the area
Home Values in the Area
Average Home Value in this Area
Purchase History
| Date | Buyer | Sale Price | Title Company |
|---|---|---|---|
| Weil Robert L | $625,000 | Fidelity National Title | |
| Deutsche Bank National Trust Co | $734,231 | Lsi Title | |
| Ybarra Michael R | $835,000 | Ticor Title Company Fullerto | |
| Alban Rhoda Gertrude | -- | -- |
Source: Public Records
Mortgage History
| Date | Status | Borrower | Loan Amount |
|---|---|---|---|
| Previous Owner | Ybarra Michael R | $668,000 |
Source: Public Records
Tax History Compared to Growth
Tax History
| Year | Tax Paid | Tax Assessment Tax Assessment Total Assessment is a certain percentage of the fair market value that is determined by local assessors to be the total taxable value of land and additions on the property. | Land | Improvement |
|---|---|---|---|---|
| 2025 | $9,486 | $820,940 | $640,403 | $180,537 |
| 2024 | $9,486 | $804,844 | $627,846 | $176,998 |
| 2023 | $9,270 | $789,063 | $615,535 | $173,528 |
| 2022 | $9,236 | $773,592 | $603,466 | $170,126 |
| 2021 | $9,037 | $758,424 | $591,633 | $166,791 |
| 2020 | $9,068 | $750,648 | $585,567 | $165,081 |
| 2019 | $8,738 | $735,930 | $574,085 | $161,845 |
| 2018 | $8,374 | $721,500 | $562,828 | $158,672 |
| 2017 | $8,198 | $707,353 | $551,792 | $155,561 |
| 2016 | $8,042 | $693,484 | $540,973 | $152,511 |
| 2015 | $7,953 | $683,068 | $532,847 | $150,221 |
| 2014 | $7,677 | $669,688 | $522,409 | $147,279 |
Source: Public Records
Map
Nearby Homes
- 4260 Dogwood Ave
- 3790 Goldenrod St
- 4601 Guava Ave
- 3520 Jasmin Cir
- 4624 Ironwood Ave
- 4725 Elder Ave
- 4765 Ironwood Ave
- 5041 Lampson Ave
- 5021 Apollo Cir
- 3831 Wisteria St
- 12441 Interior Cir
- 12741 Bartlett St
- 12278 Bridgewater Way
- 12581 Bartlett St
- 3432 Yellowtail Dr
- 12111 Reagan St
- 3342 Bradbury Rd Unit 34
- 3322 Hillrose Dr
- 12400 Montecito Rd Unit 222
- 12584 Montecito Rd Unit 5