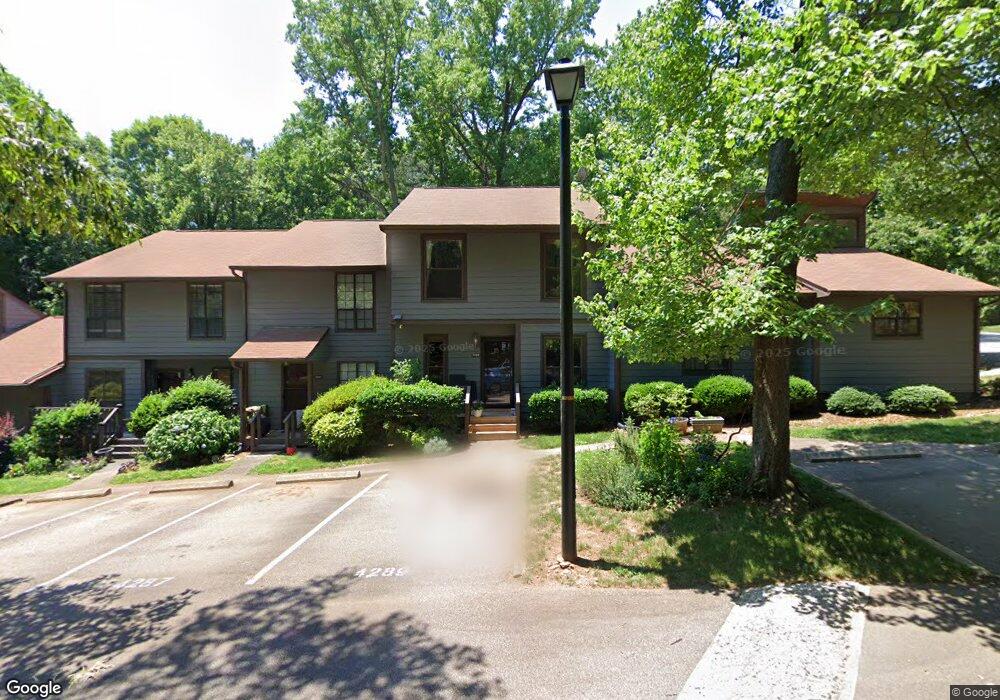
4289 The Oaks Dr Unit E4 Raleigh, NC 27606
Estimated Value: $287,000 - $301,000
3
Beds
3
Baths
1,350
Sq Ft
$217/Sq Ft
Est. Value
About This Home
This home is located at 4289 The Oaks Dr Unit E4, Raleigh, NC 27606 and is currently estimated at $292,544, approximately $216 per square foot. 4289 The Oaks Dr Unit E4 is a home located in Wake County with nearby schools including Dillard Drive Magnet Elementary School, Dillard Drive Magnet Middle School, and Adventist Christian Academy of Raleigh.
Ownership History
Date
Name
Owned For
Owner Type
Purchase Details
Closed on
Jan 2, 2008
Sold by
Lassiter Simo Jeremy Eric and Lassiter Simo Nicole
Bought by
Gad Katina
Current Estimated Value
Home Financials for this Owner
Home Financials are based on the most recent Mortgage that was taken out on this home.
Original Mortgage
$76,500
Outstanding Balance
$48,263
Interest Rate
6.15%
Mortgage Type
Purchase Money Mortgage
Estimated Equity
$244,281
Purchase Details
Closed on
Nov 25, 2003
Sold by
Simo Barry Michael
Bought by
Simo Jeremy Eric
Home Financials for this Owner
Home Financials are based on the most recent Mortgage that was taken out on this home.
Original Mortgage
$106,575
Interest Rate
5.93%
Mortgage Type
FHA
Purchase Details
Closed on
May 12, 1999
Sold by
Stewart Robert D and Stewart Ruth A
Bought by
Simo Barry Michael
Home Financials for this Owner
Home Financials are based on the most recent Mortgage that was taken out on this home.
Original Mortgage
$94,575
Interest Rate
6.98%
Create a Home Valuation Report for This Property
The Home Valuation Report is an in-depth analysis detailing your home's value as well as a comparison with similar homes in the area
Home Values in the Area
Average Home Value in this Area
Purchase History
| Date | Buyer | Sale Price | Title Company |
|---|---|---|---|
| Gad Katina | $127,500 | None Available | |
| Simo Jeremy Eric | $108,500 | -- | |
| Simo Barry Michael | $97,500 | -- |
Source: Public Records
Mortgage History
| Date | Status | Borrower | Loan Amount |
|---|---|---|---|
| Open | Gad Katina | $76,500 | |
| Previous Owner | Simo Jeremy Eric | $106,575 | |
| Previous Owner | Simo Barry Michael | $94,575 |
Source: Public Records
Tax History Compared to Growth
Tax History
| Year | Tax Paid | Tax Assessment Tax Assessment Total Assessment is a certain percentage of the fair market value that is determined by local assessors to be the total taxable value of land and additions on the property. | Land | Improvement |
|---|---|---|---|---|
| 2025 | $2,375 | $270,002 | -- | $270,002 |
| 2024 | $2,365 | $270,002 | $0 | $270,002 |
| 2023 | $1,932 | $175,383 | $0 | $175,383 |
| 2022 | $1,796 | $175,383 | $0 | $175,383 |
| 2021 | $1,726 | $175,383 | $0 | $175,383 |
| 2020 | $1,695 | $175,383 | $0 | $175,383 |
| 2019 | $1,478 | $125,837 | $0 | $125,837 |
| 2018 | $0 | $125,837 | $0 | $125,837 |
| 2017 | $0 | $125,837 | $0 | $125,837 |
| 2016 | $0 | $125,837 | $0 | $125,837 |
| 2015 | -- | $120,665 | $0 | $120,665 |
| 2014 | -- | $120,665 | $0 | $120,665 |
Source: Public Records
Map
Nearby Homes
- 4237 The Oaks Dr Unit J3
- 1704 Athens Dr
- 1033 Oak Lake Ct
- 1421 Athens Dr
- 1400 Crete Dr
- 3710 Lail Ct
- 1230 University Ct Unit 203
- 1241 University Ct Unit 204
- 1321 Crab Orchard Dr Unit 203
- 1221 University Ct Unit 304
- 5401 Kaplan Dr
- 913 Merwin Rd
- 1411 Collegiate Cir Unit 302
- 5520 Kaplan Dr
- 820 Nuttree Place
- 3418 Avent Ferry Rd
- 5101 Wickham Rd
- 944 Athens Dr
- 713 Valerie Dr
- 907 Lake Beacon Way
- 4283 The Oaks Dr Unit E1
- 4285 The Oaks Dr Unit E2
- 4287 The Oaks Dr
- 4291 The Oaks Dr
- 4291 The Oaks Dr Unit 5
- 4300 Avent Ferry Rd
- 4281 The Oaks Dr
- 4279 The Oaks Dr Unit 4
- 4128 The Oaks Dr
- 4277 The Oaks Dr
- 4275 The Oaks Dr
- 4126 The Oaks Dr Unit D4
- 4126 The Oaks Dr Unit 4
- 4273 The Oaks Dr
- 4124 The Oaks Dr
- 4122 The Oaks Dr Unit D2
- 4122 The Oaks Dr Unit 4122
- 4122 The Oaks Dr Unit 2
- 4127 The Oaks Dr
- 4129 The Oaks Dr